15310 SE 28th Way Vancouver, WA 98683
Cascade Park NeighborhoodEstimated Value: $645,296 - $663,000
2
Beds
2
Baths
1,724
Sq Ft
$380/Sq Ft
Est. Value
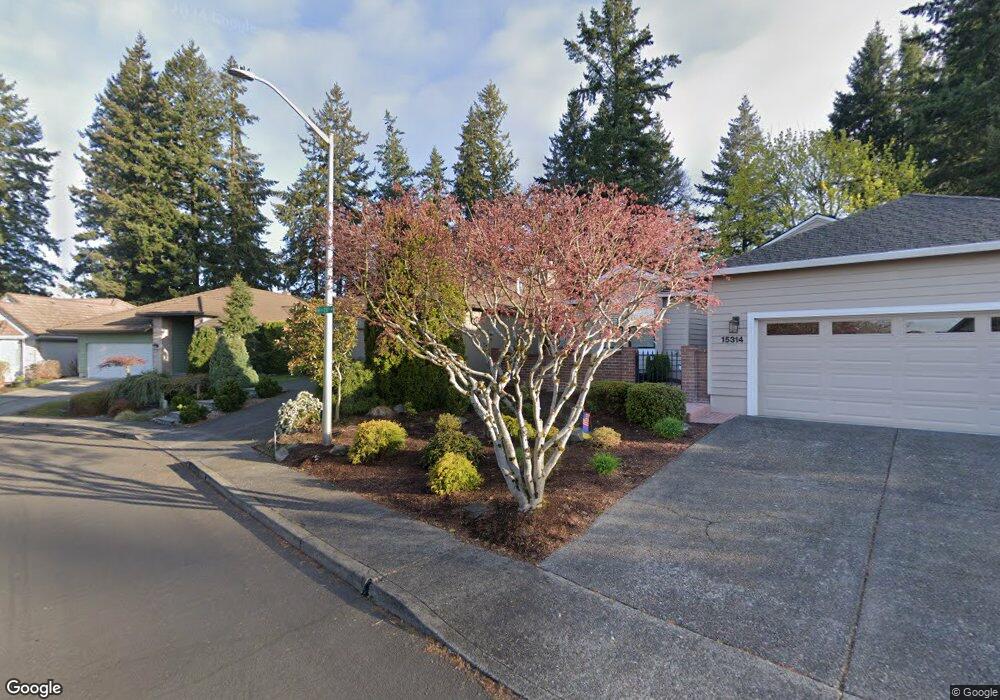
About This Home
This home is located at 15310 SE 28th Way, Vancouver, WA 98683 and is currently estimated at $655,824, approximately $380 per square foot. 15310 SE 28th Way is a home located in Clark County with nearby schools including Riverview Elementary School, Shahala Middle School, and Mountain View High School.
Ownership History
Date
Name
Owned For
Owner Type
Purchase Details
Closed on
Jul 6, 2012
Sold by
Correll Patricia E and Correll James S
Bought by
Correll Patricia E and Correll James S
Current Estimated Value
Purchase Details
Closed on
Apr 16, 2012
Sold by
Gray Donald Wayne and Gray Barbara Gayle
Bought by
Correll James S and Correll Patricia E
Home Financials for this Owner
Home Financials are based on the most recent Mortgage that was taken out on this home.
Original Mortgage
$220,000
Outstanding Balance
$151,885
Interest Rate
3.9%
Mortgage Type
New Conventional
Estimated Equity
$503,939
Purchase Details
Closed on
May 17, 2010
Sold by
Gehr Barbara
Bought by
Gray Donald Wayne and Gray Barbara Gayle
Purchase Details
Closed on
May 25, 2005
Sold by
Baptiste Charles R
Bought by
Gehr Barbara
Home Financials for this Owner
Home Financials are based on the most recent Mortgage that was taken out on this home.
Original Mortgage
$211,250
Interest Rate
5.74%
Mortgage Type
Fannie Mae Freddie Mac
Create a Home Valuation Report for This Property
The Home Valuation Report is an in-depth analysis detailing your home's value as well as a comparison with similar homes in the area
Home Values in the Area
Average Home Value in this Area
Purchase History
| Date | Buyer | Sale Price | Title Company |
|---|---|---|---|
| Correll Patricia E | -- | None Available | |
| Correll James S | $275,000 | Chicago Title | |
| Gray Donald Wayne | $325,000 | Cascade Title | |
| Gehr Barbara | $325,000 | First American Title |
Source: Public Records
Mortgage History
| Date | Status | Borrower | Loan Amount |
|---|---|---|---|
| Open | Correll James S | $220,000 | |
| Previous Owner | Gehr Barbara | $211,250 |
Source: Public Records
Tax History Compared to Growth
Tax History
| Year | Tax Paid | Tax Assessment Tax Assessment Total Assessment is a certain percentage of the fair market value that is determined by local assessors to be the total taxable value of land and additions on the property. | Land | Improvement |
|---|---|---|---|---|
| 2025 | $5,494 | $573,394 | $250,000 | $323,394 |
| 2024 | $5,359 | $553,919 | $250,000 | $303,919 |
| 2023 | $5,093 | $560,588 | $244,000 | $316,588 |
| 2022 | $4,507 | $526,372 | $235,000 | $291,372 |
| 2021 | $4,297 | $441,733 | $197,200 | $244,533 |
| 2020 | $4,275 | $397,951 | $190,000 | $207,951 |
| 2019 | $4,168 | $399,724 | $190,000 | $209,724 |
| 2018 | $4,643 | $419,729 | $0 | $0 |
| 2017 | $4,242 | $375,829 | $0 | $0 |
| 2016 | $4,005 | $355,551 | $0 | $0 |
| 2015 | $3,959 | $321,437 | $0 | $0 |
| 2014 | -- | $303,757 | $0 | $0 |
| 2013 | -- | $265,477 | $0 | $0 |
Source: Public Records
Map
Nearby Homes
- 3112 SE 156th Ave Unit 7
- 3205 SE 153rd Ave
- 2606 SE Baypoint Dr Unit 20
- 2403 SE Balboa Dr
- 2512 SE Baypoint Dr Unit 37
- 2512 SE Baypoint Dr Unit 38
- 15907 SE 29th St
- 15405 SE Graham Rd
- 2410 SE Baypoint Dr Unit 68
- 2504 SE 150th Ave
- 15719 SE 23rd St Unit 118
- 15701 SE 34th Cir
- 2052 SE 158th Loop
- 15111 SE McGillivray Blvd
- 2003 SE Briarwood Dr
- 15815 SE 35th St
- 15007 SE McGillivray Blvd
- 15003 SE McGillivray Blvd
- 1804 SE 161st Place
- 3911 SE 157th Ave
- 15314 SE 28th Way
- 15300 SE 28th Way
- 2812 SE 153rd Ave
- 15318 SE 28th Way
- 2813 SE 153rd Ave Unit 5
- 2820 SE 154th Ave
- 2816 SE 153rd Ave
- 2901 SE 153rd Ave
- 2902 SE 154th Ave Unit 5
- 2820 SE 153rd Ave
- 2903 SE 153rd Ave
- 2908 SE 154th Ave
- 2720 SE Spyglass Dr
- 2902 SE 153rd Ave
- 2716 SE Spyglass Dr
- 2804 SE Spyglass Dr
- 2905 SE 153rd Ave
- 2808 SE Spyglass Dr
- 2910 SE 154th Ave
- 2710 SE Spyglass Dr