15315 Springhill Bend Ln Cypress, TX 77429
Estimated Value: $462,000 - $498,000
5
Beds
3
Baths
3,451
Sq Ft
$140/Sq Ft
Est. Value
About This Home
This home is located at 15315 Springhill Bend Ln, Cypress, TX 77429 and is currently estimated at $482,023, approximately $139 per square foot. 15315 Springhill Bend Ln is a home located in Harris County with nearby schools including Black Elementary School, Goodson Middle, and Cypress Woods High School.
Ownership History
Date
Name
Owned For
Owner Type
Purchase Details
Closed on
Mar 18, 2009
Sold by
Gillaspy David and Gillaspy Donna
Bought by
Patterson John P and Patterson Jamie N
Current Estimated Value
Home Financials for this Owner
Home Financials are based on the most recent Mortgage that was taken out on this home.
Original Mortgage
$250,290
Outstanding Balance
$161,081
Interest Rate
5.36%
Mortgage Type
Purchase Money Mortgage
Estimated Equity
$320,942
Purchase Details
Closed on
Oct 19, 2004
Sold by
Newmark Homes Lp
Bought by
Gillaspy David and Gillaspy Donna
Home Financials for this Owner
Home Financials are based on the most recent Mortgage that was taken out on this home.
Original Mortgage
$191,451
Interest Rate
5.82%
Mortgage Type
Purchase Money Mortgage
Create a Home Valuation Report for This Property
The Home Valuation Report is an in-depth analysis detailing your home's value as well as a comparison with similar homes in the area
Home Values in the Area
Average Home Value in this Area
Purchase History
| Date | Buyer | Sale Price | Title Company |
|---|---|---|---|
| Patterson John P | -- | First American Title | |
| Gillaspy David | -- | Universal Land Title |
Source: Public Records
Mortgage History
| Date | Status | Borrower | Loan Amount |
|---|---|---|---|
| Open | Patterson John P | $250,290 | |
| Previous Owner | Gillaspy David | $191,451 | |
| Closed | Gillaspy David | $35,897 |
Source: Public Records
Tax History Compared to Growth
Tax History
| Year | Tax Paid | Tax Assessment Tax Assessment Total Assessment is a certain percentage of the fair market value that is determined by local assessors to be the total taxable value of land and additions on the property. | Land | Improvement |
|---|---|---|---|---|
| 2025 | $7,719 | $464,064 | $91,325 | $372,739 |
| 2024 | $7,719 | $454,701 | $91,325 | $363,376 |
| 2023 | $7,719 | $476,494 | $91,325 | $385,169 |
| 2022 | $9,043 | $386,168 | $65,111 | $321,057 |
| 2021 | $8,595 | $304,682 | $65,111 | $239,571 |
| 2020 | $8,715 | $299,035 | $59,008 | $240,027 |
| 2019 | $8,266 | $275,000 | $29,504 | $245,496 |
| 2018 | $3,038 | $295,000 | $29,504 | $265,496 |
| 2017 | $9,049 | $300,000 | $29,504 | $270,496 |
| 2016 | $9,033 | $319,200 | $29,504 | $289,696 |
| 2015 | $6,253 | $280,000 | $29,504 | $250,496 |
| 2014 | $6,253 | $247,500 | $29,504 | $217,996 |
Source: Public Records
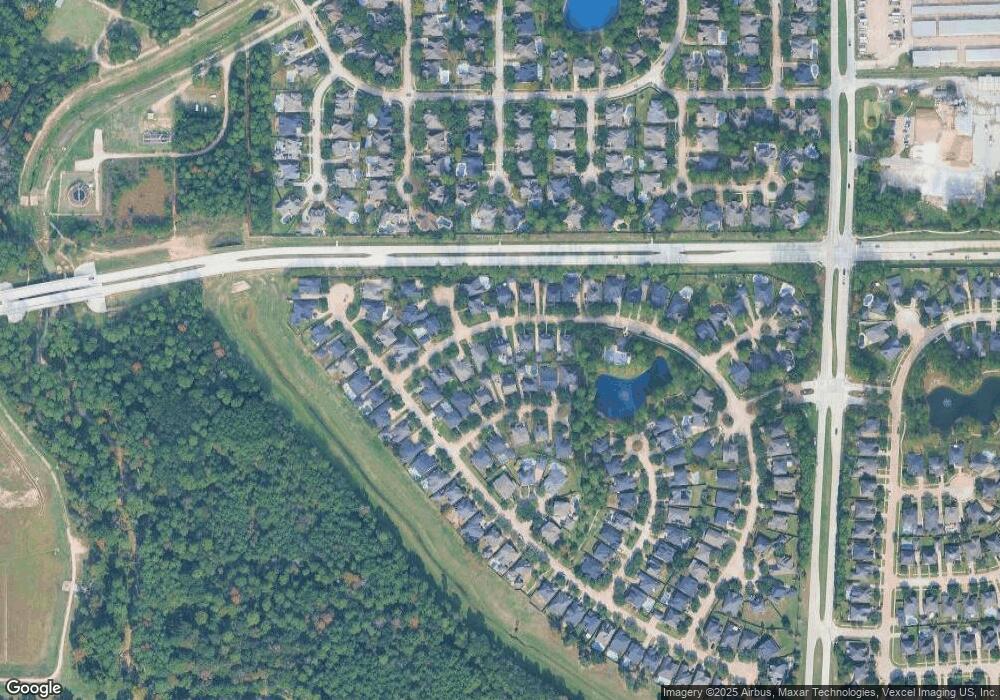
Map
Nearby Homes
- 15331 Springhill Bend Ln
- 15415 Mustang Bend Cir
- 15418 Stable Star Cir
- 15807 Telge Rd
- 15803 Telge Rd
- 15719 Pinedell Dr
- 15103 Cypress Post Ln
- 15206 Desert Star Ct
- 15826 Stable Creek Cir
- 15638 Charolais Dr
- 16003 Cypress Farms Dr
- 15334 Forest Creek Farms Dr
- 15330 Forest Creek Farms Dr
- 16043 Comal Bend Ln
- 15211 Sunlight Bay Ct
- 16019 Rustlers Trail Ln
- 16110 Peach Bluff Ln
- 13614 Boerne Canyon Ln
- 14106 Junction Creek Ln
- 16202 Peach Bluff Ln
- 15311 Springhill Bend Ln
- 15319 Springhill Bend Ln
- 15115 Shady Gate Ct
- 15119 Shady Gate Ct
- 15307 Springhill Bend Ln
- 15323 Springhill Bend Ln
- 15502 Wendover Creek Ct
- 15111 Shady Gate Ct
- 15314 Springhill Bend Ln
- 15123 Shady Gate Ct
- 15310 Springhill Bend Ln
- 15303 Springhill Bend Ln
- 15327 Springhill Bend Ln
- 15107 Shady Gate Ct
- 15506 Wendover Creek Ct
- 15306 Springhill Bend Ln
- 15503 Wendover Creek Ct
- 15127 Shady Gate Ct
- 15103 Shady Gate Ct
- 15114 Shady Gate Ct