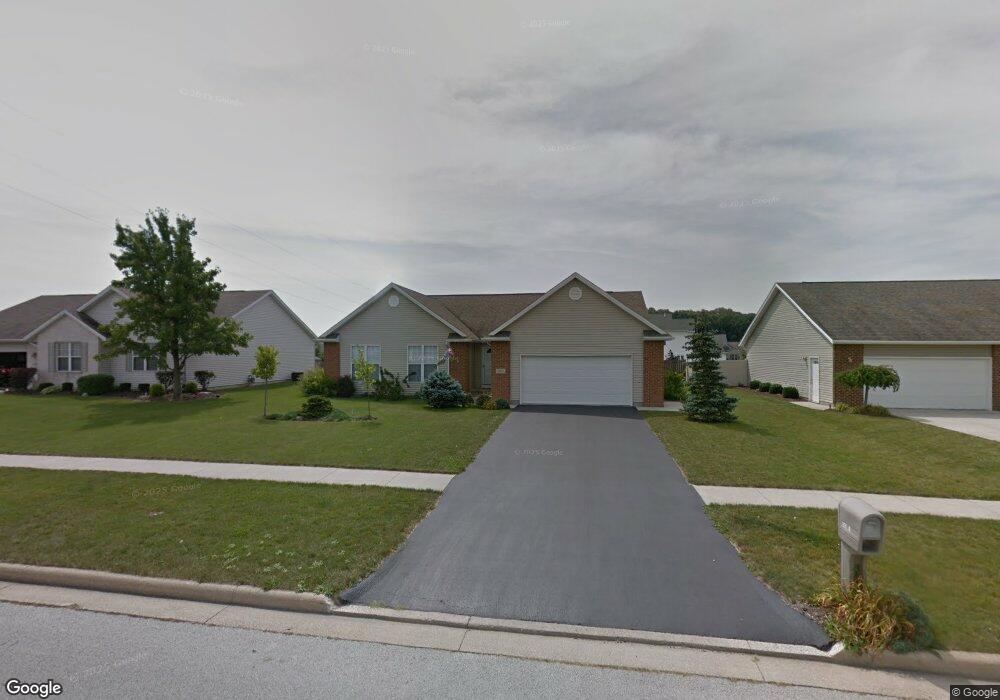
15317 Bent Tree Dr Findlay, OH 45840
Estimated Value: $351,320 - $391,000
3
Beds
3
Baths
2,010
Sq Ft
$186/Sq Ft
Est. Value
About This Home
This home is located at 15317 Bent Tree Dr, Findlay, OH 45840 and is currently estimated at $373,330, approximately $185 per square foot. 15317 Bent Tree Dr is a home located in Hancock County with nearby schools including Van Buren Elementary School, Van Buren Middle School, and Van Buren High School.
Ownership History
Date
Name
Owned For
Owner Type
Purchase Details
Closed on
May 25, 2017
Bought by
Heather L Hille and Joshua A Hille
Current Estimated Value
Home Financials for this Owner
Home Financials are based on the most recent Mortgage that was taken out on this home.
Interest Rate
3.95%
Purchase Details
Closed on
May 18, 2017
Sold by
Wagner Daniel P and St Clair Wagner Margie D
Bought by
Hille Joshua A and Hille Heather L
Home Financials for this Owner
Home Financials are based on the most recent Mortgage that was taken out on this home.
Interest Rate
3.95%
Purchase Details
Closed on
Aug 7, 2002
Sold by
Best Roger
Bought by
Wagner Daniel P and Wagner Margie D
Home Financials for this Owner
Home Financials are based on the most recent Mortgage that was taken out on this home.
Original Mortgage
$127,900
Interest Rate
6.62%
Mortgage Type
New Conventional
Create a Home Valuation Report for This Property
The Home Valuation Report is an in-depth analysis detailing your home's value as well as a comparison with similar homes in the area
Home Values in the Area
Average Home Value in this Area
Purchase History
| Date | Buyer | Sale Price | Title Company |
|---|---|---|---|
| Heather L Hille | $229,900 | -- | |
| Hille Joshua A | -- | None Available | |
| Wagner Daniel P | $173,940 | -- |
Source: Public Records
Mortgage History
| Date | Status | Borrower | Loan Amount |
|---|---|---|---|
| Closed | Heather L Hille | -- | |
| Open | Hille Joshua A | $206,900 | |
| Previous Owner | Wagner Daniel P | $127,900 |
Source: Public Records
Tax History Compared to Growth
Tax History
| Year | Tax Paid | Tax Assessment Tax Assessment Total Assessment is a certain percentage of the fair market value that is determined by local assessors to be the total taxable value of land and additions on the property. | Land | Improvement |
|---|---|---|---|---|
| 2024 | $2,923 | $93,250 | $11,400 | $81,850 |
| 2023 | $2,909 | $93,250 | $11,400 | $81,850 |
| 2022 | $2,910 | $93,250 | $11,400 | $81,850 |
| 2021 | $2,761 | $83,260 | $10,960 | $72,300 |
| 2020 | $2,759 | $83,260 | $10,960 | $72,300 |
| 2019 | $2,855 | $83,260 | $10,960 | $72,300 |
| 2018 | $2,332 | $66,970 | $9,130 | $57,840 |
| 2017 | $2,340 | $66,970 | $9,130 | $57,840 |
| 2016 | $2,276 | $66,970 | $9,130 | $57,840 |
| 2015 | $2,187 | $63,160 | $9,130 | $54,030 |
| 2014 | $2,133 | $63,160 | $9,130 | $54,030 |
| 2012 | $2,381 | $64,820 | $9,130 | $55,690 |
Source: Public Records
Map
Nearby Homes
- 7712 E Watermark Dr
- 15329 E Us Route 224
- 0 E Us Route 224
- 7507 Township Road 212
- 0 Meadowview Dr
- 665 Meadowview Dr
- 8419 E Woodland Trail
- 8457 Lakewood Dr
- 845 Fox Run Rd
- 8405 Indian Lake Dr
- 456 Strathaven Dr
- 0 Hickory Ln Unit 6133896
- 0 Hickory Ln Unit 1 307878
- 0 Hickory Ln Unit 20252999
- 801 Fox Run Rd
- 8478 Indian Lake Dr
- 16169 Forest Ln
- 2245 Fox Run Cir Unit 1037
- 15680 Thornwood Dr
- 838 Longmeadow Ln
- 15303 Bent Tree Dr
- 15331 Bent Tree Dr
- 15302 Piedmont Ct
- 15281 Bent Tree Dr
- 15314 Piedmont Ct
- 15316 Bent Tree Dr
- 15300 Bent Tree Dr
- 15361 Bent Tree Dr
- 15282 Piedmont Ct
- 15330 Bent Tree Dr
- 15280 Bent Tree Dr
- 15375 Bent Tree Dr
- 15349 S Watermark Dr
- 15347 S Watermark Dr
- 15319 Piedmont Ct
- 15339 S Watermark Dr
- 8150 Newberry Dr
- 8136 Newberry Dr
- 15268 Bent Tree Dr
- 7759 W Watermark Dr