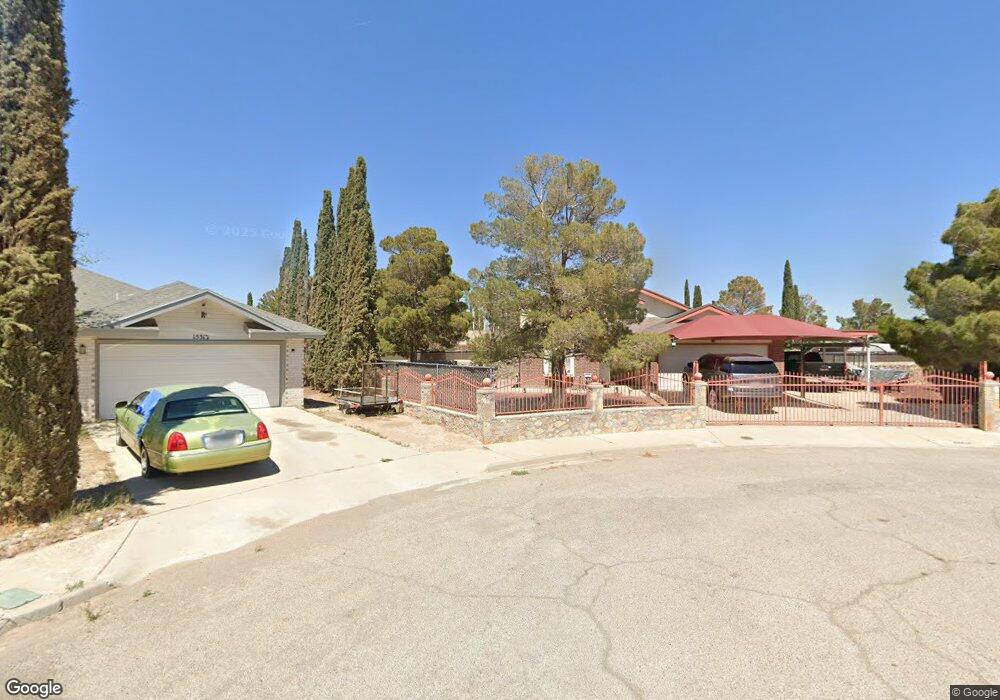
15317 Dilly Ct Horizon City, TX 79928
Estimated Value: $185,000 - $198,014
3
Beds
2
Baths
1,115
Sq Ft
$170/Sq Ft
Est. Value
About This Home
This home is located at 15317 Dilly Ct, Horizon City, TX 79928 and is currently estimated at $189,504, approximately $169 per square foot. 15317 Dilly Ct is a home located in El Paso County with nearby schools including Carroll T. Welch Elementary School, Ricardo Estrada Junior High School, and Horizon High School.
Ownership History
Date
Name
Owned For
Owner Type
Purchase Details
Closed on
Oct 2, 2025
Sold by
Leos Eduardo F
Bought by
City Bank Trust and Samson Trust
Current Estimated Value
Purchase Details
Closed on
Jul 23, 2008
Sold by
Leos Sally Ann
Bought by
Leos Eduardo F
Purchase Details
Closed on
Jun 11, 1997
Sold by
Santillan Ruben and Dunn Barbara A
Bought by
Leos Eduardo F and Leos Sally Ann
Home Financials for this Owner
Home Financials are based on the most recent Mortgage that was taken out on this home.
Original Mortgage
$64,843
Interest Rate
7.93%
Mortgage Type
FHA
Purchase Details
Closed on
Mar 10, 1995
Sold by
Mountain Vista Builders Inc
Bought by
Santillan Ruben and Dunn Barbara A
Home Financials for this Owner
Home Financials are based on the most recent Mortgage that was taken out on this home.
Original Mortgage
$58,850
Interest Rate
8.86%
Create a Home Valuation Report for This Property
The Home Valuation Report is an in-depth analysis detailing your home's value as well as a comparison with similar homes in the area
Home Values in the Area
Average Home Value in this Area
Purchase History
| Date | Buyer | Sale Price | Title Company |
|---|---|---|---|
| City Bank Trust | -- | None Listed On Document | |
| Leos Eduardo F | -- | None Available | |
| Leos Eduardo F | -- | -- | |
| Santillan Ruben | -- | -- |
Source: Public Records
Mortgage History
| Date | Status | Borrower | Loan Amount |
|---|---|---|---|
| Previous Owner | Leos Eduardo F | $64,843 | |
| Previous Owner | Santillan Ruben | $58,850 | |
| Closed | Leos Eduardo F | $0 |
Source: Public Records
Tax History Compared to Growth
Tax History
| Year | Tax Paid | Tax Assessment Tax Assessment Total Assessment is a certain percentage of the fair market value that is determined by local assessors to be the total taxable value of land and additions on the property. | Land | Improvement |
|---|---|---|---|---|
| 2025 | $3,882 | $172,622 | -- | -- |
| 2024 | $3,882 | $156,929 | -- | -- |
| 2023 | $3,882 | $142,663 | $0 | $0 |
| 2022 | $4,205 | $129,694 | $0 | $0 |
| 2021 | $4,207 | $120,734 | $19,632 | $101,102 |
| 2020 | $3,723 | $107,185 | $19,632 | $87,553 |
| 2018 | $3,570 | $106,374 | $19,632 | $86,742 |
| 2017 | $3,293 | $99,173 | $19,632 | $79,541 |
| 2016 | $3,293 | $99,173 | $19,632 | $79,541 |
| 2015 | $2,842 | $97,005 | $19,630 | $77,375 |
| 2014 | $2,842 | $97,005 | $19,630 | $77,375 |
Source: Public Records
Map
Nearby Homes
- TBD Lailey View Ct
- 15318 Northport Ct
- 440 Katherine Dr
- 14253 Bryce Dr
- 15340 Mineral Ct
- 1100 Darrington Rd
- TBD Darrington Rd
- 123 Darrington Rd
- 123688 Darrington Rd
- 2525 Darrington Rd
- PN-96884 Darrington Rd
- 13809 Centro Vista Ave
- TBD 11 Horizon City Estates #4
- 13841 Centro Vista Ave
- 13737 Centro Vista Ave
- 13833 Centro Vista Ave
- 13745 Centro Vista Ave
- 13829 Centro Vista
- 1 Acre Grey Ave
- 2.47 Acres Agatha St
- 15308 Marburn Ct
- 15313 Dilly Ct
- 15321 Dilly Ct
- 15304 Marburn Ct
- 15312 Marburn Ct
- 344 Duanesburg St
- 15309 Dilly Ct
- 340 Duanesburg St
- 15325 Dilly Ct
- 15325 Dilly Ct Unit 1
- 348 Duanesburg St
- 15316 Marburn Ct
- 15316 Marburn Ct Unit CT
- 15331 S Kenazo Ave
- 336 Duanesburg St
- 15329 S Kenazo Ave
- 352 Duanesburg St
- 15307 Marburn Ct
- 15320 Marburn Ct
- 15311 Marburn Ct