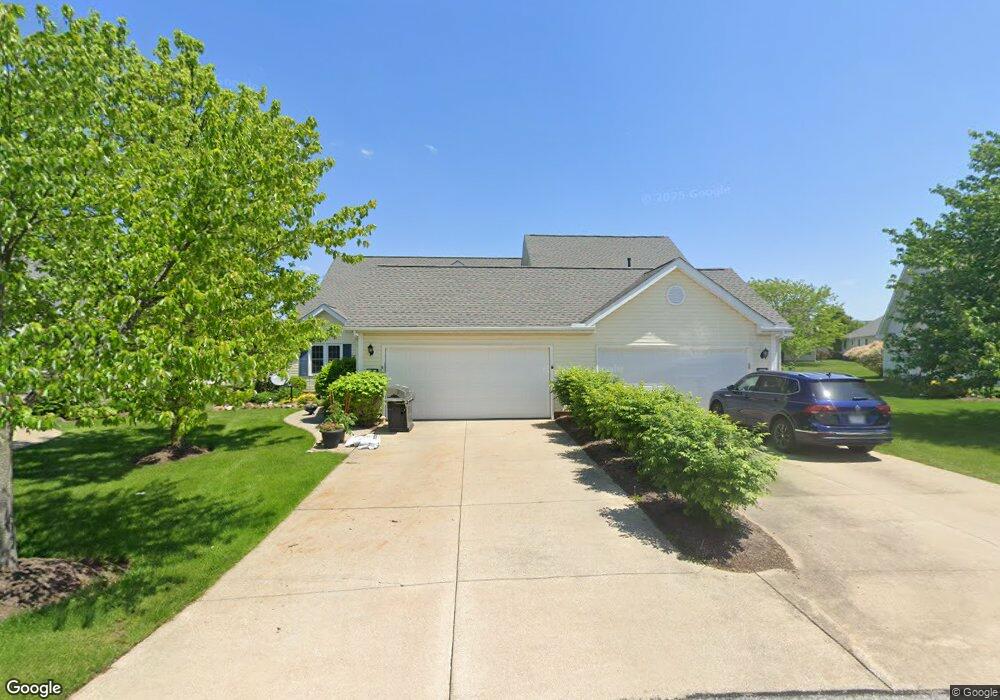
1532 Brighton Way Unit 196 Broadview Heights, OH 44147
Estimated Value: $295,000 - $320,374
3
Beds
3
Baths
1,758
Sq Ft
$176/Sq Ft
Est. Value
About This Home
This home is located at 1532 Brighton Way Unit 196, Broadview Heights, OH 44147 and is currently estimated at $309,844, approximately $176 per square foot. 1532 Brighton Way Unit 196 is a home located in Cuyahoga County with nearby schools including North Royalton Middle School, North Royalton High School, and Assumption Academy.
Ownership History
Date
Name
Owned For
Owner Type
Purchase Details
Closed on
Nov 2, 2022
Sold by
Knuff James G and Knuff Nancy M
Bought by
Knuff James G and Knuff Nancy M
Current Estimated Value
Purchase Details
Closed on
Jul 14, 2012
Sold by
Reid Charles H and Reid Susan T
Bought by
Knuff Nancy M and Knuff James G
Purchase Details
Closed on
Jul 5, 2011
Sold by
Estate Of Howard J Reid
Bought by
Knuff Nancy M and Reid Charles H
Purchase Details
Closed on
Nov 18, 1998
Sold by
Macinstosh Development Corp
Bought by
Reid Howard J and Reid Mary M
Home Financials for this Owner
Home Financials are based on the most recent Mortgage that was taken out on this home.
Original Mortgage
$100,000
Interest Rate
6.59%
Create a Home Valuation Report for This Property
The Home Valuation Report is an in-depth analysis detailing your home's value as well as a comparison with similar homes in the area
Home Values in the Area
Average Home Value in this Area
Purchase History
| Date | Buyer | Sale Price | Title Company |
|---|---|---|---|
| Knuff James G | -- | None Listed On Document | |
| Knuff Nancy M | $67,500 | Attorney | |
| Knuff Nancy M | -- | Attorney | |
| Reid Howard J | $155,100 | U S Title Agency Inc |
Source: Public Records
Mortgage History
| Date | Status | Borrower | Loan Amount |
|---|---|---|---|
| Previous Owner | Reid Howard J | $100,000 |
Source: Public Records
Tax History Compared to Growth
Tax History
| Year | Tax Paid | Tax Assessment Tax Assessment Total Assessment is a certain percentage of the fair market value that is determined by local assessors to be the total taxable value of land and additions on the property. | Land | Improvement |
|---|---|---|---|---|
| 2024 | $5,750 | $93,380 | $9,345 | $84,035 |
| 2023 | $4,775 | $71,930 | $7,180 | $64,750 |
| 2022 | $4,744 | $71,930 | $7,180 | $64,750 |
| 2021 | $4,817 | $71,930 | $7,180 | $64,750 |
| 2020 | $4,199 | $59,960 | $5,990 | $53,970 |
| 2019 | $4,082 | $171,300 | $17,100 | $154,200 |
| 2018 | $3,925 | $59,960 | $5,990 | $53,970 |
| 2017 | $3,914 | $55,200 | $5,530 | $49,670 |
| 2016 | $3,727 | $55,200 | $5,530 | $49,670 |
| 2015 | $3,569 | $55,200 | $5,530 | $49,670 |
| 2014 | $3,569 | $53,590 | $5,360 | $48,230 |
Source: Public Records
Map
Nearby Homes
- 1370 Golden Ln
- 1038 Orchard Ln
- 1435 Fireside Trail
- 1255 Arlet Ct
- 1470 Fireside Trail
- 10305 Broadview Rd
- 10369 Broadview Rd
- 1890 Hampton Run Unit 10
- 1140 Fireside Trail
- 283 Prestwick Dr
- 9990 Broadview Rd
- 1016 Kendal Dr
- 1450 W Edgerton Rd
- 126 Turnberry Crossing
- 2839 Gates Ct
- 421 Bordeaux Blvd
- 215 Prestwick Dr
- 433 Bordeaux Blvd
- 456 Bordeaux Blvd
- 425 Bordeaux Blvd
- 1536 Brighton Way Unit 1905
- 1528 Brighton Way Unit 197
- 1540 Brighton Way Unit 1904
- 1524 Brighton Way
- 1544 Brighton Way Unit 1903
- 10244 Honeysuckle Ln
- 1520 Brighton Way Unit 1909
- 1527 Brighton Way Unit 1920
- 1523 Brighton Way Unit 1919
- 1548 Brighton Way Unit 1902
- 10250 Honeysuckle Ln
- 1365 Rome Cir
- 1516 Brighton Way Unit 1910
- 1552 Brighton Way Unit 1901
- 1367 Rome Cir
- 1397 Rome Cir
- 1519 Brighton Way Unit 1918
- 1300 Fieldstone Ct
- 10258 Mayapple Place
- 1515 Brighton Way