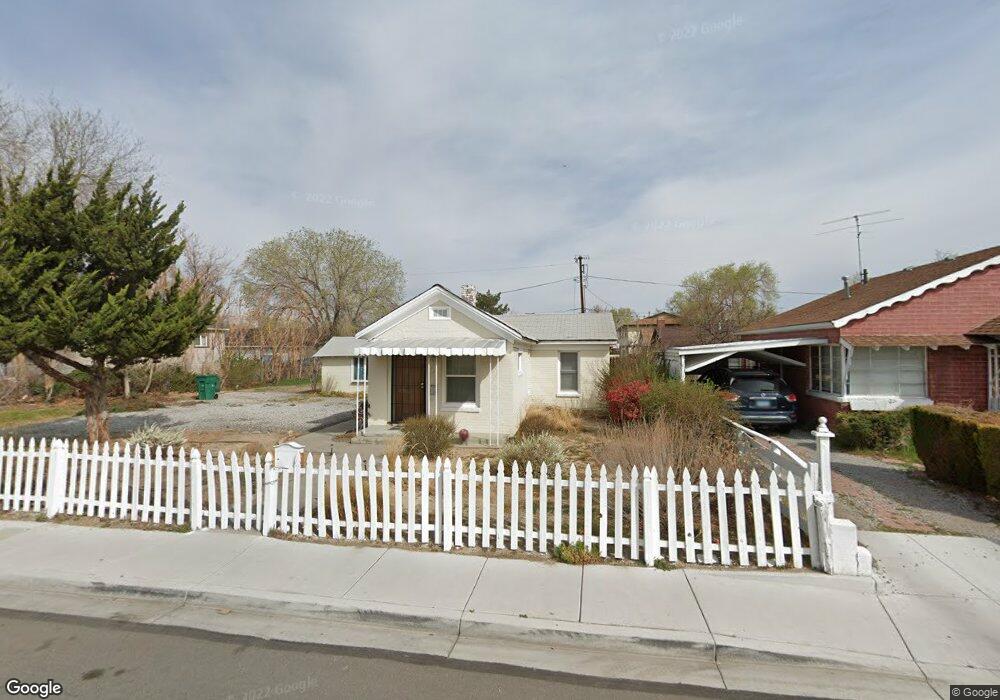
1532 F St Sparks, NV 89431
Downtown Sparks NeighborhoodEstimated Value: $222,000 - $343,000
1
Bed
1
Bath
651
Sq Ft
$443/Sq Ft
Est. Value
About This Home
This home is located at 1532 F St, Sparks, NV 89431 and is currently estimated at $288,296, approximately $442 per square foot. 1532 F St is a home located in Washoe County with nearby schools including Robert Mitchell Elementary School, Sparks Middle School, and Sparks High School.
Ownership History
Date
Name
Owned For
Owner Type
Purchase Details
Closed on
Nov 6, 2020
Sold by
Townley John M
Bought by
Townley John M and Austin Animal Rescue Trust
Current Estimated Value
Purchase Details
Closed on
Sep 28, 2007
Sold by
Townley John M and Mezzano Rochelle
Bought by
Mezzano Rochelle D and Townley John M
Purchase Details
Closed on
Apr 13, 2007
Sold by
Townley John M
Bought by
Townley John M and Mezzano Rochelle
Home Financials for this Owner
Home Financials are based on the most recent Mortgage that was taken out on this home.
Original Mortgage
$112,000
Outstanding Balance
$71,717
Interest Rate
7.25%
Mortgage Type
New Conventional
Estimated Equity
$216,579
Purchase Details
Closed on
Aug 21, 2003
Sold by
Barbagelata Francesca
Bought by
Townley John M and Mezzano Rochelle
Home Financials for this Owner
Home Financials are based on the most recent Mortgage that was taken out on this home.
Original Mortgage
$70,000
Interest Rate
5.62%
Mortgage Type
New Conventional
Create a Home Valuation Report for This Property
The Home Valuation Report is an in-depth analysis detailing your home's value as well as a comparison with similar homes in the area
Home Values in the Area
Average Home Value in this Area
Purchase History
| Date | Buyer | Sale Price | Title Company |
|---|---|---|---|
| Townley John M | -- | None Available | |
| Townley John M | -- | None Available | |
| Mezzano Rochelle D | -- | None Available | |
| Townley John M | -- | Accommodation | |
| Townley John M | -- | Stewart Title Of Northern Nv | |
| Townley John M | $87,500 | Western Title Incorporated |
Source: Public Records
Mortgage History
| Date | Status | Borrower | Loan Amount |
|---|---|---|---|
| Open | Townley John M | $112,000 | |
| Closed | Townley John M | $70,000 |
Source: Public Records
Tax History Compared to Growth
Tax History
| Year | Tax Paid | Tax Assessment Tax Assessment Total Assessment is a certain percentage of the fair market value that is determined by local assessors to be the total taxable value of land and additions on the property. | Land | Improvement |
|---|---|---|---|---|
| 2025 | $512 | $42,850 | $31,675 | $11,175 |
| 2024 | $512 | $38,905 | $27,860 | $11,045 |
| 2023 | $475 | $40,804 | $30,625 | $10,179 |
| 2022 | $461 | $30,991 | $22,680 | $8,311 |
| 2021 | $427 | $24,377 | $16,275 | $8,102 |
| 2020 | $413 | $23,804 | $15,820 | $7,984 |
| 2019 | $394 | $21,201 | $13,615 | $7,586 |
| 2018 | $383 | $17,486 | $10,220 | $7,266 |
| 2017 | $372 | $16,722 | $9,555 | $7,167 |
| 2016 | $362 | $14,588 | $7,420 | $7,168 |
| 2015 | $361 | $12,799 | $5,775 | $7,024 |
| 2014 | $350 | $10,476 | $3,815 | $6,661 |
| 2013 | -- | $9,304 | $2,730 | $6,574 |
Source: Public Records
Map
Nearby Homes