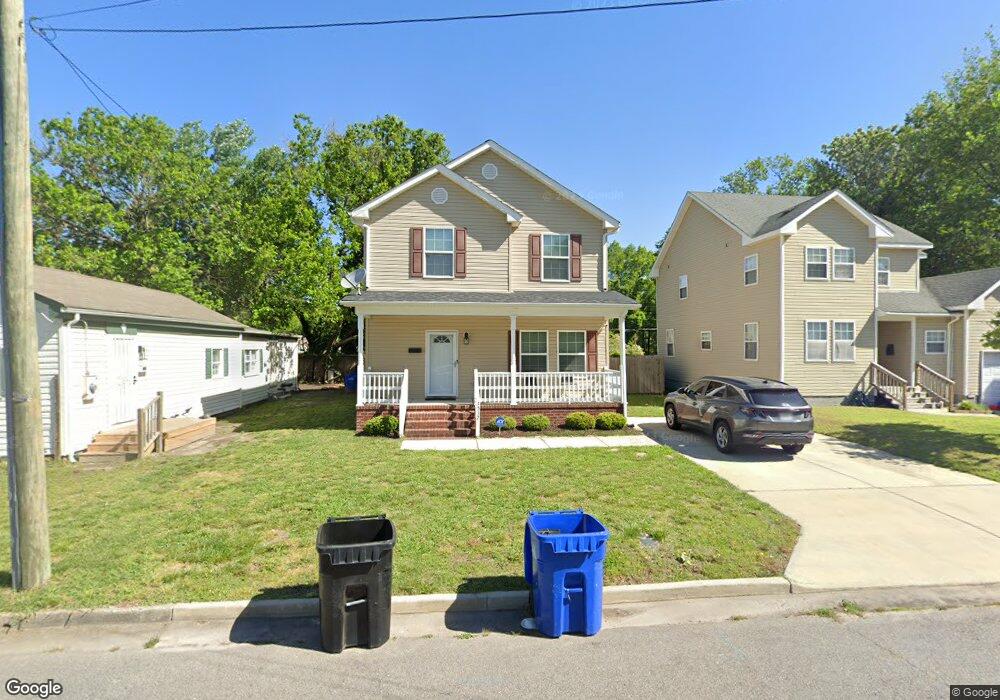
1532 Highland Ave Portsmouth, VA 23704
South Portsmouth NeighborhoodEstimated Value: $274,000 - $314,000
3
Beds
3
Baths
1,500
Sq Ft
$191/Sq Ft
Est. Value
About This Home
This home is located at 1532 Highland Ave, Portsmouth, VA 23704 and is currently estimated at $286,740, approximately $191 per square foot. 1532 Highland Ave is a home located in Portsmouth City with nearby schools including Douglass Park Elementary School, Manor High School, and St Mark Christian Academy.
Ownership History
Date
Name
Owned For
Owner Type
Purchase Details
Closed on
Feb 23, 2022
Sold by
Durant Dante D
Bought by
Ramirez Adrian and Ramirez Mandy
Current Estimated Value
Home Financials for this Owner
Home Financials are based on the most recent Mortgage that was taken out on this home.
Original Mortgage
$269,360
Outstanding Balance
$250,074
Interest Rate
3.69%
Mortgage Type
VA
Estimated Equity
$36,666
Purchase Details
Closed on
May 31, 2016
Sold by
Evans Wayne L
Bought by
Durant Dante D
Home Financials for this Owner
Home Financials are based on the most recent Mortgage that was taken out on this home.
Original Mortgage
$173,655
Interest Rate
3.61%
Mortgage Type
VA
Purchase Details
Closed on
Nov 13, 2015
Sold by
Laura John R and Hester William L
Bought by
Evans Wayne L
Purchase Details
Closed on
Oct 19, 2009
Sold by
Laura John R and Hester William L
Bought by
Laura John R and Hester William L
Create a Home Valuation Report for This Property
The Home Valuation Report is an in-depth analysis detailing your home's value as well as a comparison with similar homes in the area
Home Values in the Area
Average Home Value in this Area
Purchase History
| Date | Buyer | Sale Price | Title Company |
|---|---|---|---|
| Ramirez Adrian | $260,000 | Stewart Title Company | |
| Durant Dante D | $170,000 | Advance Title & Abstract Inc | |
| Evans Wayne L | $13,000 | Attorney | |
| Laura John R | -- | -- |
Source: Public Records
Mortgage History
| Date | Status | Borrower | Loan Amount |
|---|---|---|---|
| Open | Ramirez Adrian | $269,360 | |
| Previous Owner | Durant Dante D | $173,655 |
Source: Public Records
Tax History Compared to Growth
Tax History
| Year | Tax Paid | Tax Assessment Tax Assessment Total Assessment is a certain percentage of the fair market value that is determined by local assessors to be the total taxable value of land and additions on the property. | Land | Improvement |
|---|---|---|---|---|
| 2025 | $3,294 | $256,870 | $50,000 | $206,870 |
| 2024 | $3,294 | $253,910 | $50,000 | $203,910 |
| 2023 | $2,915 | $233,230 | $50,000 | $183,230 |
| 2022 | $2,456 | $188,950 | $40,000 | $148,950 |
| 2021 | $2,371 | $182,420 | $33,470 | $148,950 |
| 2020 | $2,270 | $174,620 | $31,880 | $142,740 |
| 2019 | $2,230 | $171,520 | $31,880 | $139,640 |
| 2018 | $2,230 | $171,520 | $31,880 | $139,640 |
| 2017 | $2,230 | $171,520 | $31,880 | $139,640 |
| 2016 | $2,230 | $171,520 | $31,880 | $139,640 |
| 2015 | $414 | $31,880 | $31,880 | $0 |
| 2014 | $405 | $31,880 | $31,880 | $0 |
Source: Public Records
Map
Nearby Homes
- 1611 Highland Ave
- 1536 Centre Ave
- 1415 Summit Ave
- 1538 Centre Ave
- 2314 Charleston Ave
- 2537 Staunton Ave
- 1237 Portsmouth Blvd
- 2506 Oak St
- 1235 Summit Ave
- 1233 Centre Ave
- 2207 Richmond Ave
- 2629 Roanoke Ave
- 1312 Hoover St
- 2810 Elm Ave
- 2605 Roanoke Ave
- 2906 Elm Ave
- 1315 Jefferson St
- 2803 Elm Ave
- 3000 Elm Ave
- 2600 Roanoke Ave
- 1532 Highland Ave Unit VA
- 1534 Highland Ave
- 1530 Highland Ave
- 1536 Highland Ave
- 1528 Highland Ave
- 1525 Portsmouth Blvd
- 1526 Highland Ave
- 1522 Highland Ave
- 1520 Highland Ave
- 1527 Highland Ave
- 1525 Highland Ave
- 1600 Portsmouth Blvd
- 2524 Lansing Ave
- 1518 Highland Ave
- 1523 Highland Ave
- 1601 Portsmouth Blvd
- 1526 Portsmouth Blvd
- 1535 Highland Ave
- 1517 Highland Ave
- 2520 Lansing Ave