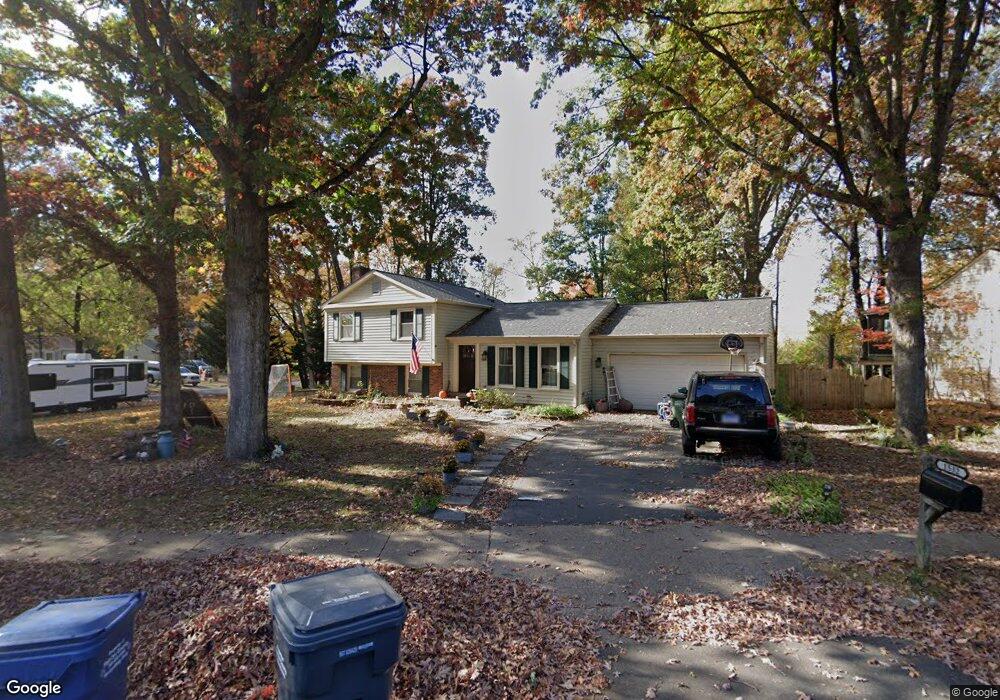
1532 Powells Tavern Place Herndon, VA 20170
Estimated Value: $672,000 - $734,000
4
Beds
3
Baths
1,118
Sq Ft
$626/Sq Ft
Est. Value
About This Home
This home is located at 1532 Powells Tavern Place, Herndon, VA 20170 and is currently estimated at $700,086, approximately $626 per square foot. 1532 Powells Tavern Place is a home located in Fairfax County with nearby schools including Dranesville Elementary, Herndon Middle School, and Herndon High School.
Ownership History
Date
Name
Owned For
Owner Type
Purchase Details
Closed on
Aug 6, 2019
Sold by
Toscano Mark E and Matheny Pamela
Bought by
Matheny Pamela and Matheny Micah
Current Estimated Value
Home Financials for this Owner
Home Financials are based on the most recent Mortgage that was taken out on this home.
Original Mortgage
$379,500
Outstanding Balance
$332,372
Interest Rate
3.7%
Mortgage Type
New Conventional
Estimated Equity
$367,714
Purchase Details
Closed on
Oct 25, 2002
Sold by
Middleton Karin C
Bought by
Toscano Mark E
Home Financials for this Owner
Home Financials are based on the most recent Mortgage that was taken out on this home.
Original Mortgage
$239,920
Interest Rate
6.2%
Purchase Details
Closed on
Aug 18, 1994
Sold by
Brown Samuel A
Bought by
Brown Randy R
Home Financials for this Owner
Home Financials are based on the most recent Mortgage that was taken out on this home.
Original Mortgage
$152,900
Interest Rate
8.61%
Create a Home Valuation Report for This Property
The Home Valuation Report is an in-depth analysis detailing your home's value as well as a comparison with similar homes in the area
Home Values in the Area
Average Home Value in this Area
Purchase History
| Date | Buyer | Sale Price | Title Company |
|---|---|---|---|
| Matheny Pamela | -- | Westcor Land Title Ins Co | |
| Toscano Mark E | $299,900 | -- | |
| Brown Randy R | $169,900 | -- |
Source: Public Records
Mortgage History
| Date | Status | Borrower | Loan Amount |
|---|---|---|---|
| Open | Matheny Pamela | $379,500 | |
| Previous Owner | Toscano Mark E | $239,920 | |
| Previous Owner | Brown Randy R | $152,900 |
Source: Public Records
Tax History Compared to Growth
Tax History
| Year | Tax Paid | Tax Assessment Tax Assessment Total Assessment is a certain percentage of the fair market value that is determined by local assessors to be the total taxable value of land and additions on the property. | Land | Improvement |
|---|---|---|---|---|
| 2025 | $7,206 | $611,130 | $245,000 | $366,130 |
| 2024 | $7,206 | $564,850 | $235,000 | $329,850 |
| 2023 | $6,913 | $563,170 | $235,000 | $328,170 |
| 2022 | $6,498 | $521,210 | $220,000 | $301,210 |
| 2021 | $5,973 | $470,070 | $195,000 | $275,070 |
| 2020 | $5,602 | $437,600 | $190,000 | $247,600 |
| 2019 | $5,407 | $420,060 | $190,000 | $230,060 |
| 2018 | $4,771 | $414,880 | $188,000 | $226,880 |
| 2017 | $4,983 | $395,080 | $179,000 | $216,080 |
| 2016 | $4,785 | $378,370 | $172,000 | $206,370 |
| 2015 | $4,688 | $383,960 | $172,000 | $211,960 |
| 2014 | $4,552 | $372,790 | $167,000 | $205,790 |
Source: Public Records
Map
Nearby Homes
- 1305 E Maple Ave
- 11 Butternut Way
- 19 Butternut Way
- 1314 E Holly Ave
- 12703 Longleaf Ln
- 12592 Rock Ridge Rd
- 1307 E Holly Ave
- 1112 E Maple Ave
- 1106 E Maple Ave
- 2007 Jonathan Dr
- 229 Applegate Dr
- 104 N Garfield Rd
- 105 Deerwood Ct
- 113 N Harrison Rd
- 131 N Garfield Rd
- 187 Saint Johns Square
- 1372 Dominion Ridge Ln
- 316 Hanford Ct
- 221 N Emory Dr Unit 4
- 12535 Misty Water Dr
- 12804 Reams Station Place
- 1530 Powells Tavern Place
- 1536 Powells Tavern Place
- 12806 Reams Station Place
- 1531 Powells Tavern Place
- 1533 Powells Tavern Place
- 12803 Reams Station Place
- 1529 Powells Tavern Place
- 1535 Powells Tavern Place
- 12805 Reams Station Place
- 1538 Powells Tavern Place
- 1526 Powells Tavern Place
- 12808 Reams Station Place
- 1522 Shellbark Pi
- 1524 Shellbark Place
- 1522 Shellbark Place
- 1526 Shellbark Place
- 1539 Powells Tavern Place
- 12826 Longleaf Ln
- 1606 E Madison Ct