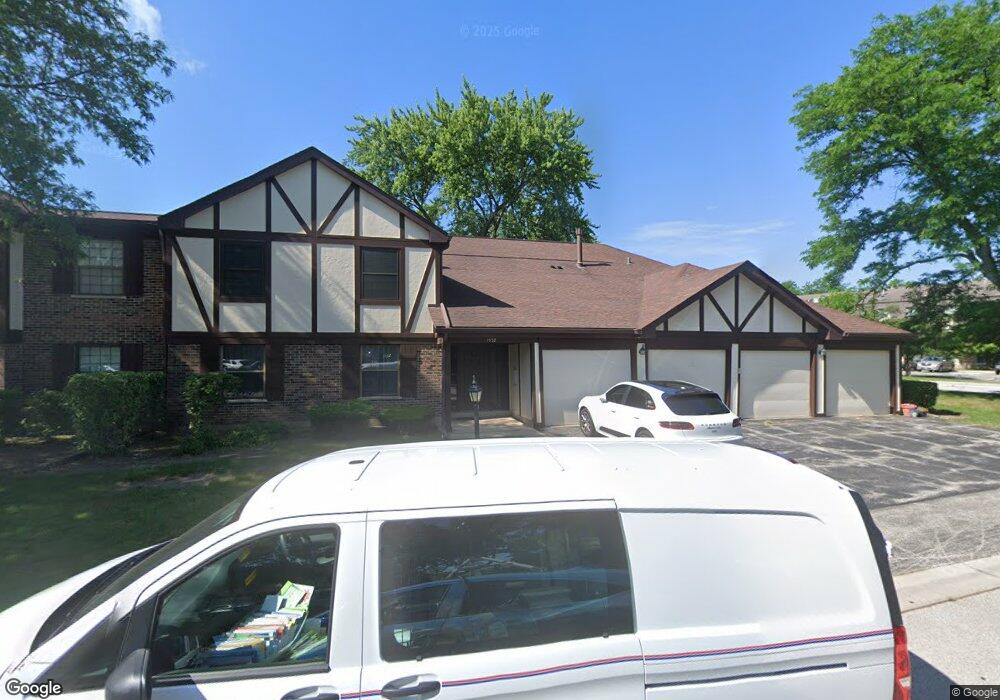
1532 Springview Ct Unit 139D Wheeling, IL 60090
Estimated Value: $251,447 - $281,000
2
Beds
--
Bath
139,350
Sq Ft
$2/Sq Ft
Est. Value
About This Home
This home is located at 1532 Springview Ct Unit 139D, Wheeling, IL 60090 and is currently estimated at $264,862, approximately $1 per square foot. 1532 Springview Ct Unit 139D is a home located in Cook County with nearby schools including Booth Tarkington Elementary School, Jack London Middle School, and Wheeling High School.
Ownership History
Date
Name
Owned For
Owner Type
Purchase Details
Closed on
Aug 17, 2020
Sold by
Schmidly Rebecca A
Bought by
Kim Yun Soo and Kim Fabian
Current Estimated Value
Purchase Details
Closed on
Mar 10, 2015
Sold by
Citimortgage Inc
Bought by
Schmidly Rebecca A
Home Financials for this Owner
Home Financials are based on the most recent Mortgage that was taken out on this home.
Original Mortgage
$92,800
Interest Rate
3.68%
Mortgage Type
New Conventional
Purchase Details
Closed on
Dec 19, 2014
Sold by
Rakowsky
Bought by
Citimortgage Inc
Purchase Details
Closed on
Mar 31, 1999
Sold by
Murphy Howard G and Murphy Joan M
Bought by
Rakowsky Craig P
Home Financials for this Owner
Home Financials are based on the most recent Mortgage that was taken out on this home.
Original Mortgage
$108,640
Interest Rate
6.94%
Mortgage Type
FHA
Create a Home Valuation Report for This Property
The Home Valuation Report is an in-depth analysis detailing your home's value as well as a comparison with similar homes in the area
Home Values in the Area
Average Home Value in this Area
Purchase History
| Date | Buyer | Sale Price | Title Company |
|---|---|---|---|
| Kim Yun Soo | $171,000 | Attorney | |
| Schmidly Rebecca A | $116,000 | 1St American Title | |
| Citimortgage Inc | -- | None Available | |
| Rakowsky Craig P | $112,000 | -- |
Source: Public Records
Mortgage History
| Date | Status | Borrower | Loan Amount |
|---|---|---|---|
| Previous Owner | Schmidly Rebecca A | $92,800 | |
| Previous Owner | Rakowsky Craig P | $108,640 |
Source: Public Records
Tax History
| Year | Tax Paid | Tax Assessment Tax Assessment Total Assessment is a certain percentage of the fair market value that is determined by local assessors to be the total taxable value of land and additions on the property. | Land | Improvement |
|---|---|---|---|---|
| 2025 | $5,570 | $25,611 | $777 | $24,834 |
| 2024 | $5,570 | $16,621 | $875 | $15,746 |
| 2023 | $5,312 | $16,621 | $875 | $15,746 |
| 2022 | $5,312 | $16,621 | $875 | $15,746 |
| 2021 | $3,686 | $9,948 | $485 | $9,463 |
| 2020 | $1,575 | $9,948 | $485 | $9,463 |
| 2019 | $2,497 | $11,051 | $485 | $10,566 |
| 2018 | $2,549 | $10,420 | $388 | $10,032 |
| 2017 | $2,519 | $10,420 | $388 | $10,032 |
| 2016 | $2,643 | $10,420 | $388 | $10,032 |
| 2015 | $2,526 | $9,713 | $1,457 | $8,256 |
| 2014 | $2,483 | $9,713 | $1,457 | $8,256 |
| 2013 | -- | $9,713 | $1,457 | $8,256 |
Source: Public Records
Map
Nearby Homes
- 1507 Clearwater Ln Unit 1
- 709 Lakeside Circle Dr Unit 2
- 791 Lakeside Circle Dr Unit 1
- 2822 Jackson Dr
- 2812 Jackson Dr
- 1504 Chippewa Trail
- 3026 Jackson Dr
- 413 Buffalo Trail Unit 10601
- 2643 N Prindle Ave
- 404 Arrow Trail Unit 10103
- 2604 N Prindle Ave
- 2126 E Waverly Ln
- 1014 Lakeland Ct Unit 2A
- 1025 Cottonwood Ct Unit 2AR
- 1030 Cottonwood Ct Unit 2A
- 1530 E Fleming Dr S
- 1522 E Fleming Dr N
- 1810 E Waverly Dr
- 200 Lake Blvd Unit 402
- 2632 N Windsor Dr Unit 104
- 1532 Springview Ct Unit 139D
- 1532 Springview Ct Unit 139C
- 1532 Springview Ct Unit 139C
- 1532 Springview Ct Unit C2
- 1532 Springview Ct Unit D1
- 1532 Springview Ct Unit C1
- 1534 Springview Ct Unit 139A
- 1534 Springview Ct Unit 139B
- 1534 Springview Ct Unit 139A
- 1534 Springview Ct Unit 139B
- 1534 Springview Ct Unit 2 bed 2 bath renovat
- 1534 Springview Ct Unit B2
- 1534 Springview Ct Unit A1
- 1546 Springview Ct Unit B2
- 1546 Springview Ct Unit 1312
- 1546 Springview Ct Unit 1312
- 1546 Springview Ct Unit 1312
- 1546 Springview Ct Unit 1312
- 1546 Springview Ct Unit 2B
- 1546 Springview Ct Unit A1
Your Personal Tour Guide
Ask me questions while you tour the home.