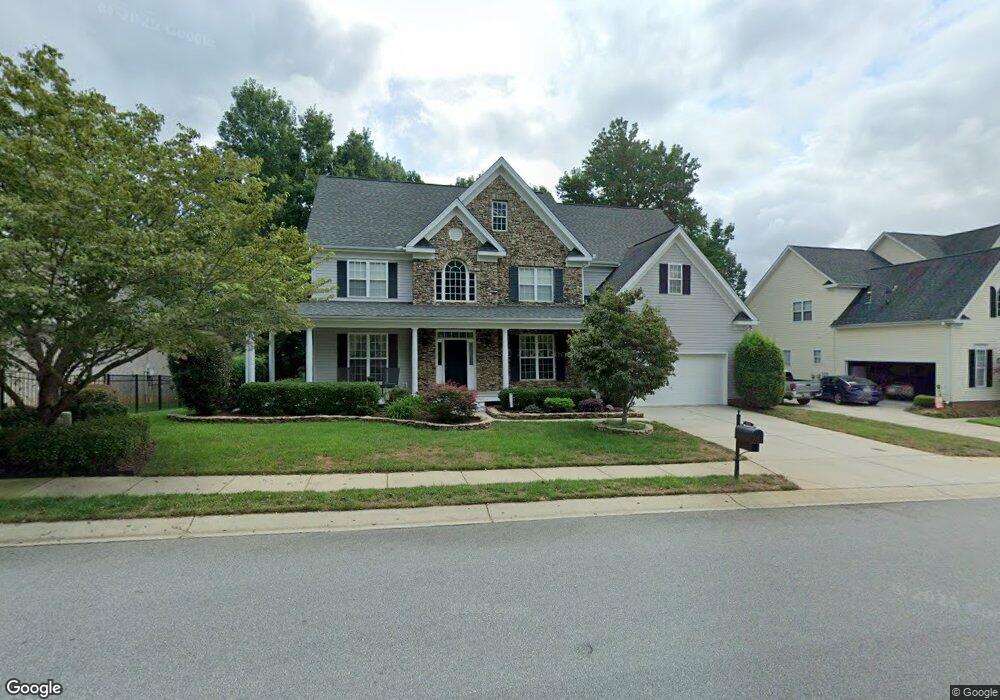
1532 Valhalla Dr Denver, NC 28037
Estimated Value: $590,330 - $785,000
4
Beds
3
Baths
3,226
Sq Ft
$208/Sq Ft
Est. Value
About This Home
This home is located at 1532 Valhalla Dr, Denver, NC 28037 and is currently estimated at $672,583, approximately $208 per square foot. 1532 Valhalla Dr is a home located in Lincoln County with nearby schools including St. James Elementary School, East Lincoln Middle School, and East Lincoln High School.
Ownership History
Date
Name
Owned For
Owner Type
Purchase Details
Closed on
Jun 3, 2009
Sold by
Paysinger Charles C and Anderson Margaret M
Bought by
Paysinger Charles C and Anderson Margaret M
Current Estimated Value
Home Financials for this Owner
Home Financials are based on the most recent Mortgage that was taken out on this home.
Original Mortgage
$158,065
Outstanding Balance
$99,868
Interest Rate
4.77%
Mortgage Type
New Conventional
Estimated Equity
$572,715
Purchase Details
Closed on
Oct 14, 2005
Sold by
Sparacio Michael J
Bought by
Paysinger Charles C
Home Financials for this Owner
Home Financials are based on the most recent Mortgage that was taken out on this home.
Original Mortgage
$126,200
Interest Rate
5.66%
Mortgage Type
Purchase Money Mortgage
Purchase Details
Closed on
Nov 1, 1999
Bought by
Sparacio Michael J
Purchase Details
Closed on
May 18, 1999
Bought by
Niblock Development Corp
Create a Home Valuation Report for This Property
The Home Valuation Report is an in-depth analysis detailing your home's value as well as a comparison with similar homes in the area
Home Values in the Area
Average Home Value in this Area
Purchase History
| Date | Buyer | Sale Price | Title Company |
|---|---|---|---|
| Paysinger Charles C | -- | None Available | |
| Paysinger Charles C | $318,000 | None Available | |
| Sparacio Michael J | $329,500 | -- | |
| Niblock Development Corp | $142,500 | -- |
Source: Public Records
Mortgage History
| Date | Status | Borrower | Loan Amount |
|---|---|---|---|
| Open | Paysinger Charles C | $158,065 | |
| Closed | Paysinger Charles C | $126,200 |
Source: Public Records
Tax History Compared to Growth
Tax History
| Year | Tax Paid | Tax Assessment Tax Assessment Total Assessment is a certain percentage of the fair market value that is determined by local assessors to be the total taxable value of land and additions on the property. | Land | Improvement |
|---|---|---|---|---|
| 2025 | $3,526 | $559,598 | $107,000 | $452,598 |
| 2024 | $3,494 | $559,598 | $107,000 | $452,598 |
| 2023 | $3,489 | $559,598 | $107,000 | $452,598 |
| 2022 | $2,907 | $376,778 | $85,000 | $291,778 |
| 2021 | $2,881 | $376,778 | $85,000 | $291,778 |
| 2020 | $2,690 | $376,778 | $85,000 | $291,778 |
| 2019 | $2,690 | $376,778 | $85,000 | $291,778 |
| 2018 | $2,383 | $314,304 | $83,500 | $230,804 |
| 2017 | $2,282 | $314,304 | $83,500 | $230,804 |
| 2016 | $2,274 | $314,304 | $83,500 | $230,804 |
| 2015 | $2,415 | $314,304 | $83,500 | $230,804 |
| 2014 | $2,289 | $303,129 | $83,500 | $219,629 |
Source: Public Records
Map
Nearby Homes
- 1567 Withers Dr
- 1763 Mount Carmel Cir
- 7245 Willow Brook Ct
- 1775 Mount Carmel Cir
- 1487 Winged Foot Dr
- 1486 Winged Foot Dr
- 1791 Withers Dr
- 1515 Baltusrol Dr
- 1365 Winged Foot Dr
- 7362 Hemlock Ct
- 1376 Winged Foot Dr
- 7246 Windy Ridge Dr
- 000 Verdict Ridge Dr Unit 284
- 2273 Pine Valley Dr
- 1063 Ventosa Dr
- 1038 Misty Creek Dr Unit 38
- 1064 Ventosa Dr
- 1207 Misty Creek Dr
- 2A Ventosa Dr
- Lot 6 Jerry Ross Ln
- 1536 Valhalla Dr
- 1524 Valhalla Dr
- 1514 Valhalla Dr
- 1546 Valhalla Dr
- 1535 Valhalla Dr
- 1547 Valhalla Dr
- 1515 Valhalla Dr
- 1504 Valhalla Dr
- 1550 Valhalla Dr
- 1507 Valhalla Dr
- 1565 Valhalla Dr
- 1492 Valhalla Dr
- 1546 Withers Dr
- 1560 Valhalla Dr
- 1556 Withers Dr
- 1499 Valhalla Dr
- Lot332 Withers Ct
- Lot334 Withers Ct
- 334 Withers Dr
- 332 Withers Dr