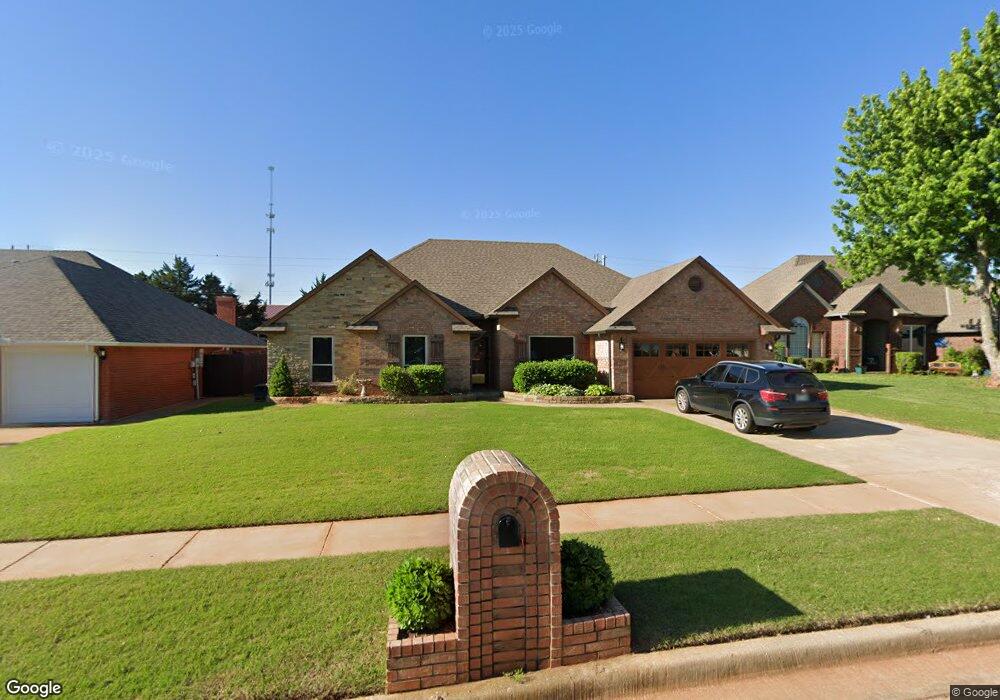
1532 W Onyx Way Mustang, OK 73064
Estimated Value: $317,000 - $359,000
4
Beds
3
Baths
2,301
Sq Ft
$148/Sq Ft
Est. Value
About This Home
This home is located at 1532 W Onyx Way, Mustang, OK 73064 and is currently estimated at $339,740, approximately $147 per square foot. 1532 W Onyx Way is a home located in Canadian County with nearby schools including Mustang Lakehoma Elementary School, Mustang Horizon Intermediate School, and Mustang Middle School.
Ownership History
Date
Name
Owned For
Owner Type
Purchase Details
Closed on
Dec 22, 2016
Sold by
Koumbis Kimberly F and Koumbis Ioannis G
Bought by
Mcdonald Sheryl F and Mcdonald Bryan W
Current Estimated Value
Home Financials for this Owner
Home Financials are based on the most recent Mortgage that was taken out on this home.
Original Mortgage
$252,100
Outstanding Balance
$203,440
Interest Rate
3.5%
Mortgage Type
Adjustable Rate Mortgage/ARM
Estimated Equity
$136,300
Purchase Details
Closed on
Aug 31, 2005
Sold by
Sadorra Marcello G and Sadorra Billie D
Bought by
Bahavar Kimberly F
Home Financials for this Owner
Home Financials are based on the most recent Mortgage that was taken out on this home.
Original Mortgage
$150,000
Interest Rate
5.78%
Purchase Details
Closed on
May 23, 1995
Sold by
Tipton Larry J and Tipton Luann C
Purchase Details
Closed on
Jan 2, 1992
Sold by
Conversion
Purchase Details
Closed on
Aug 28, 1991
Create a Home Valuation Report for This Property
The Home Valuation Report is an in-depth analysis detailing your home's value as well as a comparison with similar homes in the area
Home Values in the Area
Average Home Value in this Area
Purchase History
| Date | Buyer | Sale Price | Title Company |
|---|---|---|---|
| Mcdonald Sheryl F | $260,000 | First American Title Company | |
| Bahavar Kimberly F | $121,875 | None Available | |
| -- | $114,900 | -- | |
| -- | $100,000 | -- | |
| -- | -- | -- |
Source: Public Records
Mortgage History
| Date | Status | Borrower | Loan Amount |
|---|---|---|---|
| Open | Mcdonald Sheryl F | $252,100 | |
| Previous Owner | Bahavar Kimberly F | $150,000 |
Source: Public Records
Tax History Compared to Growth
Tax History
| Year | Tax Paid | Tax Assessment Tax Assessment Total Assessment is a certain percentage of the fair market value that is determined by local assessors to be the total taxable value of land and additions on the property. | Land | Improvement |
|---|---|---|---|---|
| 2024 | $2,951 | $31,492 | $2,716 | $28,776 |
| 2023 | $2,951 | $30,575 | $2,400 | $28,175 |
| 2022 | $2,896 | $29,684 | $2,400 | $27,284 |
| 2021 | $2,931 | $29,914 | $2,400 | $27,514 |
| 2020 | $2,860 | $29,043 | $2,400 | $26,643 |
| 2019 | $2,774 | $28,197 | $2,400 | $25,797 |
| 2018 | $2,749 | $27,376 | $2,400 | $24,976 |
| 2017 | $2,661 | $26,821 | $2,400 | $24,421 |
| 2016 | $2,305 | $22,322 | $2,400 | $19,922 |
| 2015 | $2,324 | $21,519 | $2,400 | $19,119 |
| 2014 | $2,324 | $23,384 | $1,680 | $21,704 |
Source: Public Records
Map
Nearby Homes
- 320 N Jasper Way
- 309 N Topaz Way
- 401 N Topaz Way
- 11617 SW 56th St
- 716 N Cottontail Way
- 4213 Moonlight Rd
- 4408 Moonlight Rd
- 609 N Centennial Way
- 400 N Amethyst Way
- 608 N White Tail Way
- 612 N White Tail Way
- 708 N White Tail Way
- 2001 W Crossbow Way
- 313 N Shannon Way
- 1924 W Flintlock Way
- 708 N Buckhorn Way
- 513 N Shannon Way
- 821 N Clear Springs Way
- 1931 W Flintlock Way
- 1935 W Flintlock Way
- 1528 W Onyx Way
- 1536 W Onyx Way
- 1524 W Onyx Way
- 1529 W Onyx Way
- 300 N Jasper Way
- 1540 W Onyx Way
- 1525 W Onyx Way
- 301 N Jasper Way
- 305 N Jasper Way
- 1521 W Onyx Way
- 306 N Jasper Way
- 1526 W Diamond Way
- 1519 W Onyx Way
- 1524 W Diamond Way
- 309 N Jasper Way
- 1450 W Onyx Way
- 314 N Jasper Way
- 313 N Jasper Way
- 1522 W Diamond Way
- 1527 W Diamond Way