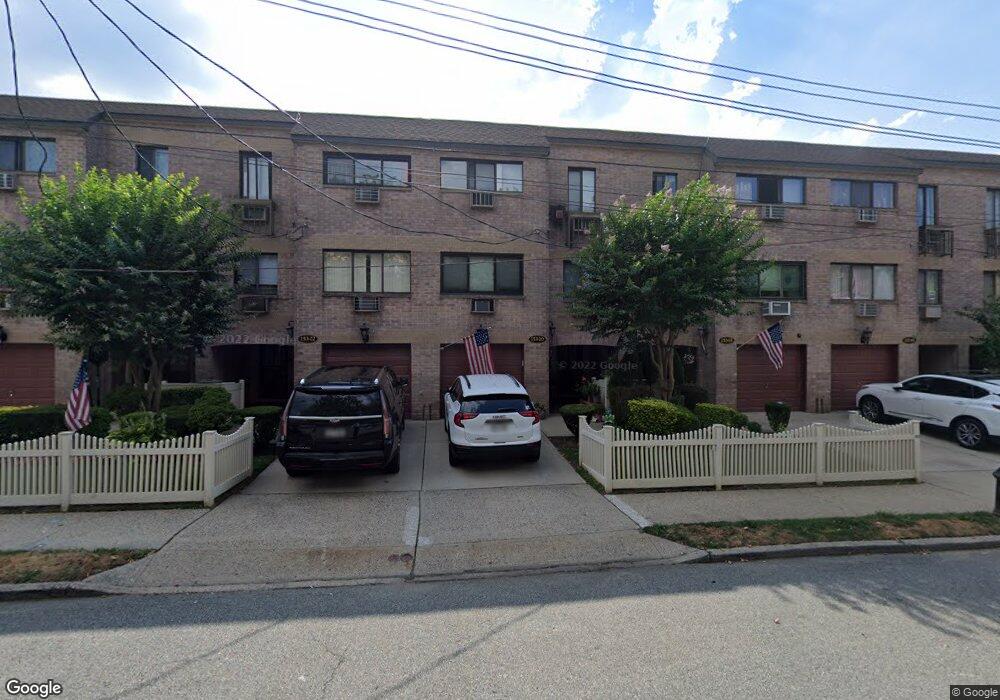
15320 83rd St Unit 5A Howard Beach, NY 11414
Howard Beach NeighborhoodEstimated Value: $519,000 - $607,644
--
Bed
--
Bath
1,471
Sq Ft
$394/Sq Ft
Est. Value
About This Home
This home is located at 15320 83rd St Unit 5A, Howard Beach, NY 11414 and is currently estimated at $580,161, approximately $394 per square foot. 15320 83rd St Unit 5A is a home located in Queens County with nearby schools including P.S. 232 - Lindenwood, Robert H. Goddard High School, and John Adams High School.
Ownership History
Date
Name
Owned For
Owner Type
Purchase Details
Closed on
May 14, 2025
Sold by
Labita Leonard
Bought by
Ozcan Cuneyt
Current Estimated Value
Home Financials for this Owner
Home Financials are based on the most recent Mortgage that was taken out on this home.
Original Mortgage
$380,000
Outstanding Balance
$378,652
Interest Rate
6.64%
Mortgage Type
Purchase Money Mortgage
Estimated Equity
$201,509
Purchase Details
Closed on
Mar 9, 2021
Sold by
Dicasoli Angela M and Riccio Angela M
Bought by
Labita Leonard
Home Financials for this Owner
Home Financials are based on the most recent Mortgage that was taken out on this home.
Original Mortgage
$459,000
Interest Rate
2.73%
Mortgage Type
Purchase Money Mortgage
Purchase Details
Closed on
Mar 31, 2000
Sold by
Paquette Michael and Paquette Susan
Bought by
Riccio Angela M and Riccio Craig L
Create a Home Valuation Report for This Property
The Home Valuation Report is an in-depth analysis detailing your home's value as well as a comparison with similar homes in the area
Home Values in the Area
Average Home Value in this Area
Purchase History
| Date | Buyer | Sale Price | Title Company |
|---|---|---|---|
| Ozcan Cuneyt | $680,000 | -- | |
| Labita Leonard | $510,000 | -- | |
| Labita Leonard | $510,000 | -- | |
| Riccio Angela M | -- | -- | |
| Riccio Angela M | -- | -- |
Source: Public Records
Mortgage History
| Date | Status | Borrower | Loan Amount |
|---|---|---|---|
| Open | Ozcan Cuneyt | $380,000 | |
| Previous Owner | Labita Leonard | $459,000 |
Source: Public Records
Tax History Compared to Growth
Tax History
| Year | Tax Paid | Tax Assessment Tax Assessment Total Assessment is a certain percentage of the fair market value that is determined by local assessors to be the total taxable value of land and additions on the property. | Land | Improvement |
|---|---|---|---|---|
| 2025 | $3,383 | $16,972 | $16 | $16,956 |
| 2024 | $3,378 | $16,842 | $19 | $16,823 |
| 2023 | $3,192 | $15,890 | $20 | $15,870 |
| 2022 | $2,911 | $23,505 | $31 | $23,474 |
| 2021 | $2,895 | $20,507 | $31 | $20,476 |
| 2020 | $2,616 | $22,368 | $31 | $22,337 |
| 2019 | $2,561 | $23,546 | $31 | $23,515 |
| 2018 | $2,402 | $13,242 | $16 | $13,226 |
| 2017 | $2,247 | $12,493 | $16 | $12,477 |
| 2016 | $2,046 | $12,493 | $16 | $12,477 |
| 2015 | $1,202 | $11,786 | $20 | $11,766 |
| 2014 | $1,202 | $11,696 | $20 | $11,676 |
Source: Public Records
Map
Nearby Homes
- 153-24 83rd St
- 8211 155th Ave Unit 9D
- 82-26 155th Ave Unit 1
- 82-26 155th Ave Unit 2nd Level
- 84-10 153rd Ave Unit 3K
- 84-20 153rd Ave Unit 5H
- 155-04 84th St Unit 1
- 84-09 155th Ave Unit 5C
- 84-09 155th Ave Unit 3A
- 8409 155th Ave Unit 5A
- 81-12 155th Ave Unit 54
- 151-35 84th St Unit 1C
- 155-18 84th St Unit 1
- 155-14 84th St Unit 2R
- 155-29 84th St Unit 3
- 8420 153rd Ave Unit 6H
- 84-29 155th Ave Unit 6J
- 81- 29 156th Ave Unit 4
- 15115 84th St Unit 3M
- 151-15 84th St Unit 3E
- 153-20 83rd St
- 153-20 83rd St Unit 5Au
- 15320 83 Rd St
- 15322 83rd St Unit 6D
- 15322 83rd St Unit 6D
- 15318 83rd St Unit 5B
- 15318 83rd St Unit 5B
- 15318 83rd St Unit 5B-U
- 15318 83rd St Unit 5B-G
- 15318 83rd St Unit 5B-D
- 153-18 83rd St Unit 5B-U
- 15324 83rd St Unit 6C
- 15324 83rd St Unit 6C
- 15316 83rd St Unit 5C
- 15316 83rd St Unit 5C
- 15316 83rd St Unit 5C-G
- 15316 83rd St Unit 5C-D
- 15316 83rd St Unit 5C-U
- 15326 83rd St Unit 6B
- 15326 83rd St Unit 6B