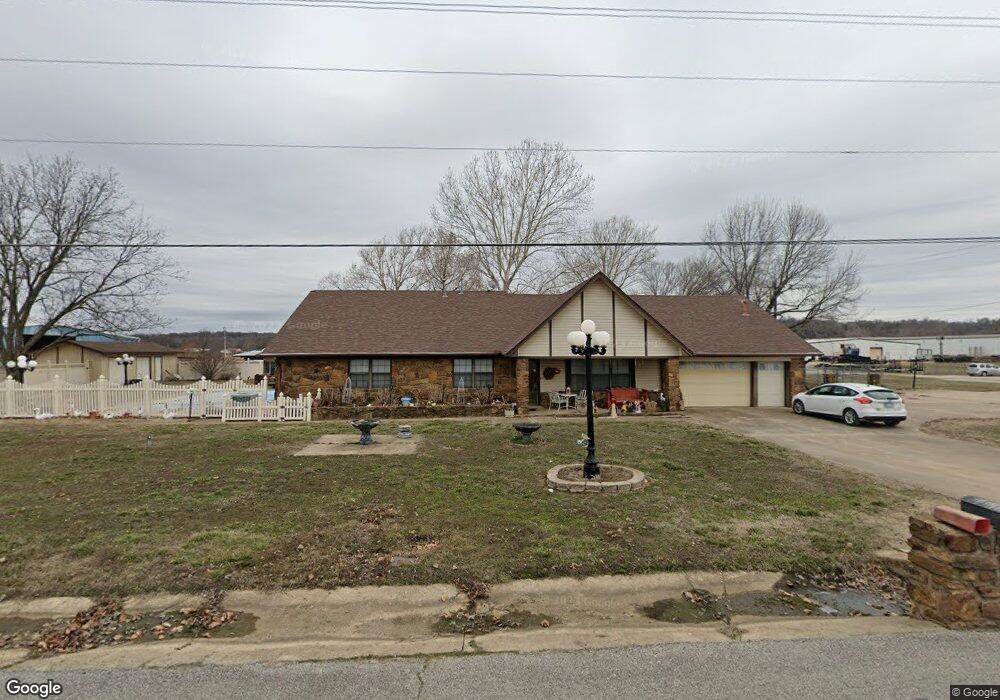
15320 S 4187 Rd Claremore, OK 74017
Estimated Value: $220,000 - $319,726
3
Beds
2
Baths
2,166
Sq Ft
$133/Sq Ft
Est. Value
About This Home
This home is located at 15320 S 4187 Rd, Claremore, OK 74017 and is currently estimated at $288,682, approximately $133 per square foot. 15320 S 4187 Rd is a home with nearby schools including Sequoyah Elementary School and Sequoyah High School.
Create a Home Valuation Report for This Property
The Home Valuation Report is an in-depth analysis detailing your home's value as well as a comparison with similar homes in the area
Home Values in the Area
Average Home Value in this Area
Tax History Compared to Growth
Tax History
| Year | Tax Paid | Tax Assessment Tax Assessment Total Assessment is a certain percentage of the fair market value that is determined by local assessors to be the total taxable value of land and additions on the property. | Land | Improvement |
|---|---|---|---|---|
| 2025 | $1,637 | $17,037 | $921 | $16,116 |
| 2024 | $1,596 | $16,542 | $895 | $15,647 |
| 2023 | $1,596 | $16,060 | $805 | $15,255 |
| 2022 | $1,565 | $15,592 | $718 | $14,874 |
| 2021 | $1,475 | $15,592 | $720 | $14,872 |
| 2020 | $1,482 | $15,138 | $632 | $14,506 |
| 2019 | $1,424 | $14,697 | $511 | $14,186 |
| 2018 | $1,387 | $14,269 | $451 | $13,818 |
| 2017 | $1,336 | $13,450 | $358 | $13,092 |
| 2016 | $1,292 | $13,058 | $312 | $12,746 |
| 2015 | $1,275 | $12,678 | $265 | $12,413 |
| 2014 | $1,252 | $12,309 | $216 | $12,093 |
Source: Public Records
Map
Nearby Homes
- 0 4187 Rd Unit 2507470
- 14319 S Brendan Blvd
- 17135 S Creekwood Ct
- 16370 E 450 Rd
- 1604 Pinecrest Dr
- 1506 Pinecrest Dr
- 17980 E 430 Rd
- 15671 S 4210 Rd
- 16254 E 410 Rd
- 17090 S 4170 Rd
- 14800 Cedar Dr
- 17791 S 4180 Rd
- 14397 S 4210 Rd
- 5 E 370
- 0 E 450 Unit 2520859
- 14228 S Blue Stem
- 0 E 450 Unit 2546002
- 12795 S 4200 Rd
- 14800 S 4220 Rd
- 12667 S Oak Ave
- 15325 S 4187 Rd
- 0 S 4187 Rd
- null S 4187 Rd
- 0 4187 Rd Unit 2431294
- 0 4187 Rd Unit 1917873
- 0 4187 Rd Unit 2015858
- 0 4187 Rd Unit 2119101
- 15271 Oklahoma 66
- 6690 S Highway 66 Hwy
- 15301 S Highway 66
- 15150 S 4187 Rd
- 15251 S 4187 Rd
- 15371 S 4187 Rd
- 15101 S 4187 Rd
- 15441 S 4187 Rd
- 15303 S 4187 Rd
- 15205 S 4187 Rd
- 15820 E 430 Rd
- 15431 S 4187 Rd
- 15491 S Highway 66