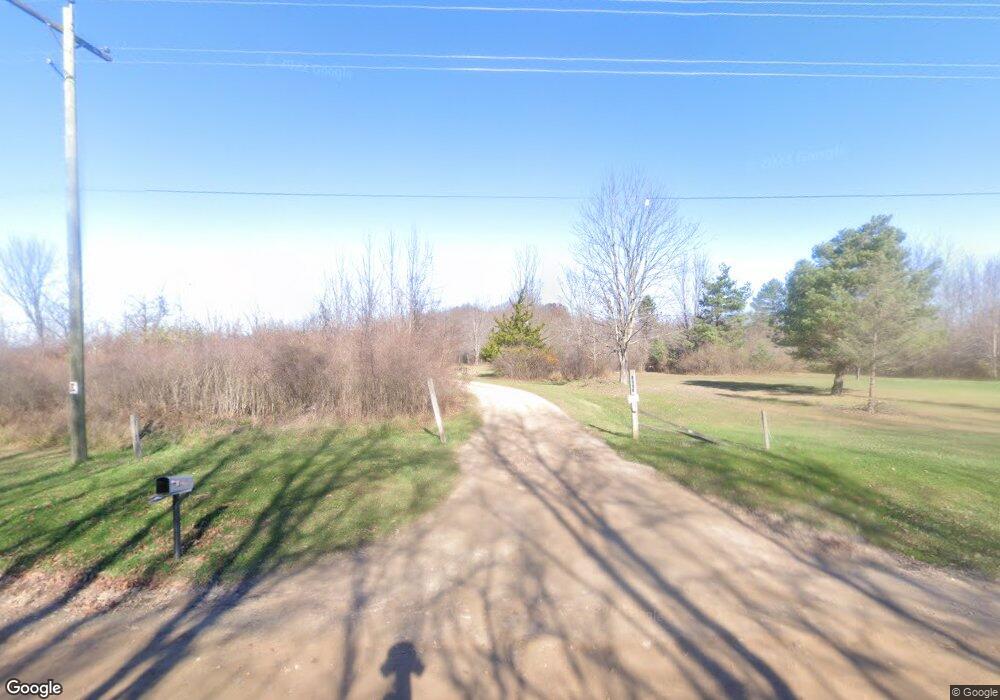
1533 111th Ave Otsego, MI 49078
Estimated Value: $235,000 - $307,000
Studio
2
Baths
1,144
Sq Ft
$228/Sq Ft
Est. Value
About This Home
This home is located at 1533 111th Ave, Otsego, MI 49078 and is currently estimated at $260,333, approximately $227 per square foot. 1533 111th Ave is a home located in Allegan County with nearby schools including Otsego High School and Otsego Christian Academy.
Ownership History
Date
Name
Owned For
Owner Type
Purchase Details
Closed on
Jul 31, 2015
Sold by
Yun John and Pearce Laura J
Bought by
Fisher Barbara A
Current Estimated Value
Purchase Details
Closed on
Oct 26, 2012
Sold by
Wright Tiffany
Bought by
Fisher Short Michael
Home Financials for this Owner
Home Financials are based on the most recent Mortgage that was taken out on this home.
Original Mortgage
$91,854
Interest Rate
3.32%
Mortgage Type
FHA
Purchase Details
Closed on
May 7, 2010
Sold by
Bradley Laura J and Pearce Laura J
Bought by
Wright Tiffany and Fisher Short Michael
Home Financials for this Owner
Home Financials are based on the most recent Mortgage that was taken out on this home.
Original Mortgage
$93,279
Interest Rate
5.25%
Mortgage Type
FHA
Purchase Details
Closed on
Apr 1, 1990
Sold by
Pigeon Woodrow A and Pigeon Patricia L
Bought by
"Cline
Purchase Details
Closed on
May 1, 1989
Sold by
Browne Neil N
Bought by
Woodrow and Patricia Pigeon
Purchase Details
Closed on
Jul 1, 1984
Sold by
Neil Browne
Bought by
Woodrow Pegeon
Create a Home Valuation Report for This Property
The Home Valuation Report is an in-depth analysis detailing your home's value as well as a comparison with similar homes in the area
Purchase History
| Date | Buyer | Sale Price | Title Company |
|---|---|---|---|
| Fisher Barbara A | $15,000 | Attorney | |
| Fisher Short Michael | -- | Fidelity Natl Title Co Llc | |
| Wright Tiffany | $95,000 | Chicago Title Of Michigan | |
| "Cline | $14,000 | -- | |
| "Cline | $14,000 | -- | |
| Woodrow | -- | -- | |
| Woodrow Pegeon | $12,000 | -- | |
| Woodrow Pegeon | $12,000 | -- |
Source: Public Records
Mortgage History
| Date | Status | Borrower | Loan Amount |
|---|---|---|---|
| Previous Owner | Fisher Short Michael | $91,854 | |
| Previous Owner | Wright Tiffany | $93,279 |
Source: Public Records
Tax History
| Year | Tax Paid | Tax Assessment Tax Assessment Total Assessment is a certain percentage of the fair market value that is determined by local assessors to be the total taxable value of land and additions on the property. | Land | Improvement |
|---|---|---|---|---|
| 2025 | $2,641 | $152,400 | $44,500 | $107,900 |
| 2024 | $2,229 | $133,200 | $39,500 | $93,700 |
| 2023 | $2,269 | $114,900 | $37,100 | $77,800 |
| 2022 | $2,229 | $105,200 | $33,700 | $71,500 |
| 2021 | $2,106 | $100,900 | $32,200 | $68,700 |
| 2020 | $2,079 | $93,000 | $31,500 | $61,500 |
| 2019 | $2,011 | $85,100 | $27,600 | $57,500 |
| 2018 | $1,968 | $77,100 | $27,200 | $49,900 |
| 2017 | $0 | $64,200 | $14,000 | $50,200 |
| 2016 | $0 | $62,300 | $14,000 | $48,300 |
| 2015 | -- | $62,300 | $14,000 | $48,300 |
| 2014 | $1,413 | $65,200 | $14,400 | $50,800 |
| 2013 | $1,413 | $59,500 | $15,600 | $43,900 |
Source: Public Records
Map
Nearby Homes
- 1209 14th St
- 1198 108th Ave
- 516 Catherine St
- 301 Helen Ave
- 799 Topview Dr
- 216 N Wilmott St
- VL 107th Ave
- 1431 Michigan 89
- 361 W Allegan St
- 229 W Orleans St
- 365 W Orleans St
- 377 W Orleans St
- 303 W Franklin St
- 324 S Fair St
- 2057 108th Ave
- 528 Lincoln Rd
- 842 10th St
- 1249 116th Ave
- 1157 Wood Ridge Dr Unit 79
- 508 S Farmer St
Your Personal Tour Guide
Ask me questions while you tour the home.