1533 9th St N Fargo, ND 58102
Washington NeighborhoodEstimated Value: $235,243 - $278,000
4
Beds
2
Baths
1,108
Sq Ft
$228/Sq Ft
Est. Value
About This Home
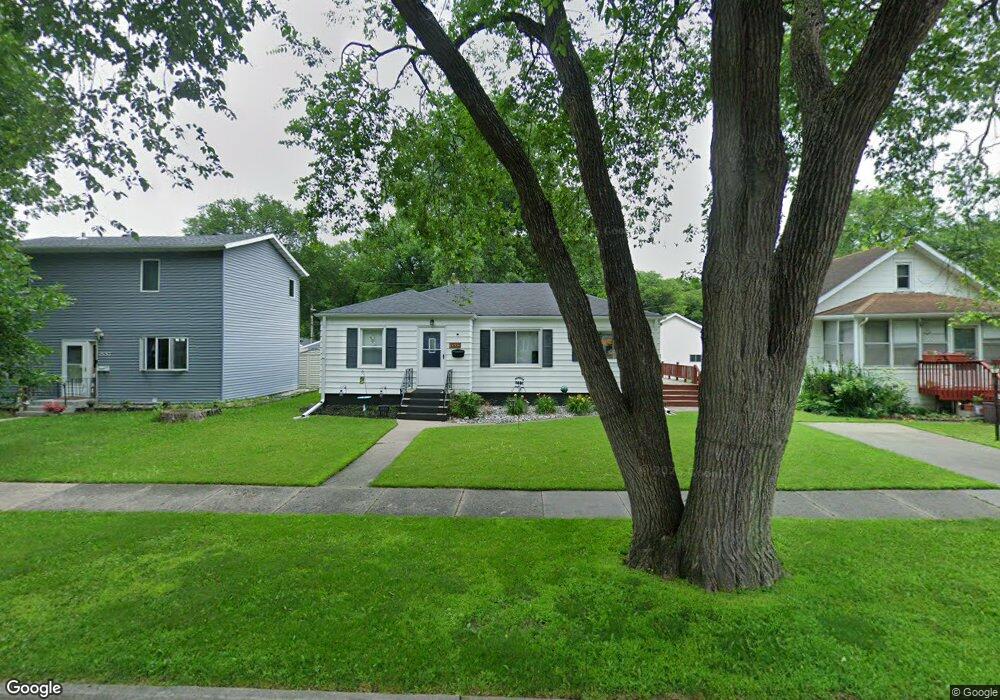
This home is located at 1533 9th St N, Fargo, ND 58102 and is currently estimated at $252,811, approximately $228 per square foot. 1533 9th St N is a home located in Cass County with nearby schools including Washington Elementary School, Ben Franklin Middle School, and North High School.
Ownership History
Date
Name
Owned For
Owner Type
Purchase Details
Closed on
Aug 18, 2022
Sold by
Beaulier Scott A and Beaulier Anemone R
Bought by
Chan Alberto V Cabo
Current Estimated Value
Home Financials for this Owner
Home Financials are based on the most recent Mortgage that was taken out on this home.
Original Mortgage
$388,000
Outstanding Balance
$367,171
Interest Rate
5.3%
Mortgage Type
New Conventional
Estimated Equity
-$114,360
Purchase Details
Closed on
Sep 20, 2013
Sold by
Neumann Robert B
Bought by
Potter Christopher J and Potter Michelle G
Home Financials for this Owner
Home Financials are based on the most recent Mortgage that was taken out on this home.
Original Mortgage
$169,928
Interest Rate
4.39%
Mortgage Type
VA
Purchase Details
Closed on
Feb 15, 2011
Sold by
Nowak Michael A and Nowak Rachel
Bought by
Neumann Robert B
Home Financials for this Owner
Home Financials are based on the most recent Mortgage that was taken out on this home.
Original Mortgage
$62,000
Interest Rate
4.81%
Mortgage Type
New Conventional
Purchase Details
Closed on
Mar 31, 2005
Sold by
Fowler Thomas A and Fowler Sharon
Bought by
Nowak Michael A
Home Financials for this Owner
Home Financials are based on the most recent Mortgage that was taken out on this home.
Original Mortgage
$121,043
Interest Rate
5%
Mortgage Type
FHA
Create a Home Valuation Report for This Property
The Home Valuation Report is an in-depth analysis detailing your home's value as well as a comparison with similar homes in the area
Home Values in the Area
Average Home Value in this Area
Purchase History
| Date | Buyer | Sale Price | Title Company |
|---|---|---|---|
| Chan Alberto V Cabo | $485,000 | The Title Company | |
| Potter Christopher J | $164,500 | Fm Title | |
| Neumann Robert B | -- | -- | |
| Nowak Michael A | -- | -- |
Source: Public Records
Mortgage History
| Date | Status | Borrower | Loan Amount |
|---|---|---|---|
| Open | Chan Alberto V Cabo | $388,000 | |
| Previous Owner | Potter Christopher J | $169,928 | |
| Previous Owner | Neumann Robert B | $62,000 | |
| Previous Owner | Nowak Michael A | $121,043 |
Source: Public Records
Tax History
| Year | Tax Paid | Tax Assessment Tax Assessment Total Assessment is a certain percentage of the fair market value that is determined by local assessors to be the total taxable value of land and additions on the property. | Land | Improvement |
|---|---|---|---|---|
| 2025 | $1,652 | $119,300 | $20,150 | $99,150 |
| 2024 | $2,672 | $116,400 | $20,050 | $96,350 |
| 2023 | $2,952 | $108,800 | $20,050 | $88,750 |
| 2022 | $2,942 | $106,650 | $20,050 | $86,600 |
| 2021 | $2,728 | $100,600 | $20,050 | $80,550 |
| 2020 | $2,567 | $95,800 | $20,050 | $75,750 |
| 2019 | $2,570 | $95,800 | $11,900 | $83,900 |
| 2018 | $2,517 | $95,050 | $11,900 | $83,150 |
| 2017 | $2,331 | $88,850 | $11,900 | $76,950 |
| 2016 | $1,951 | $80,750 | $11,900 | $68,850 |
| 2015 | $2,078 | $80,750 | $8,150 | $72,600 |
| 2014 | $1,831 | $68,150 | $8,150 | $60,000 |
| 2013 | $1,752 | $64,900 | $8,150 | $56,750 |
Source: Public Records
Map
Nearby Homes
- 1542 8th St N
- 1525 10th St N
- 1613 10th St N
- 1501 10th St N
- 1518 Broadway N
- 1530 11th St N
- 3216 Broadway N
- 1437 Broadway N Unit 101
- 801 17th Ave N
- 1306 5th St N
- 1349 4th St N
- 1250 5th St N
- 1345 3rd St N
- 1235 11 1 2 St N
- 1257 4th St N
- 1841 3rd St N
- 330 21st Ave N
- 77 18th Ave N
- 2301 9th St N
- 305 21st Ave N
Your Personal Tour Guide
Ask me questions while you tour the home.