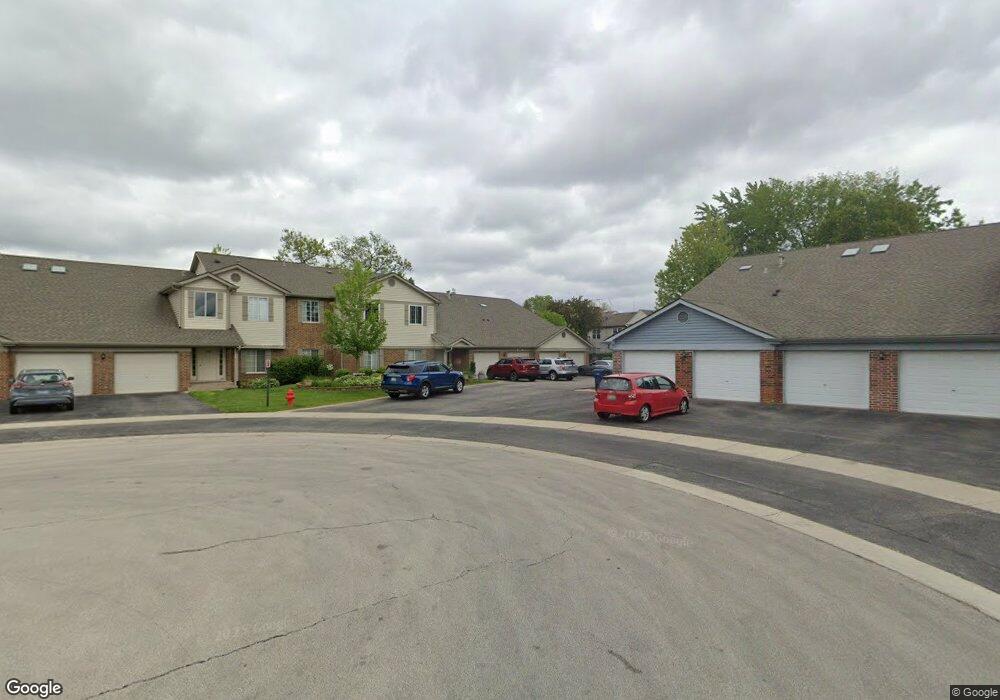
1533 Commodore Ct Unit 70245 Schaumburg, IL 60193
South Schaumburg NeighborhoodEstimated Value: $274,000 - $292,000
2
Beds
--
Bath
1,200
Sq Ft
$237/Sq Ft
Est. Value
About This Home
This home is located at 1533 Commodore Ct Unit 70245, Schaumburg, IL 60193 and is currently estimated at $284,702, approximately $237 per square foot. 1533 Commodore Ct Unit 70245 is a home located in Cook County with nearby schools including Hanover Highlands Elementary School, Robert Frost Junior High School, and Schaumburg High School.
Ownership History
Date
Name
Owned For
Owner Type
Purchase Details
Closed on
Sep 7, 2012
Sold by
Gore Joanne D and Folkerts Joanne D
Bought by
Noor Mohamed Noor and Noor Mohamed Shah Banu
Current Estimated Value
Home Financials for this Owner
Home Financials are based on the most recent Mortgage that was taken out on this home.
Original Mortgage
$87,750
Interest Rate
3.59%
Mortgage Type
New Conventional
Purchase Details
Closed on
Oct 26, 1994
Sold by
Gore Kurt E
Bought by
Gore Joanne D
Purchase Details
Closed on
Sep 28, 1993
Sold by
Gore Joanne D and Gore Kurt E
Bought by
Gore Kurt E and Gore Joanne D
Create a Home Valuation Report for This Property
The Home Valuation Report is an in-depth analysis detailing your home's value as well as a comparison with similar homes in the area
Home Values in the Area
Average Home Value in this Area
Purchase History
| Date | Buyer | Sale Price | Title Company |
|---|---|---|---|
| Noor Mohamed Noor | $117,500 | None Available | |
| Gore Joanne D | -- | -- | |
| Gore Kurt E | -- | -- |
Source: Public Records
Mortgage History
| Date | Status | Borrower | Loan Amount |
|---|---|---|---|
| Closed | Noor Mohamed Noor | $87,750 |
Source: Public Records
Tax History Compared to Growth
Tax History
| Year | Tax Paid | Tax Assessment Tax Assessment Total Assessment is a certain percentage of the fair market value that is determined by local assessors to be the total taxable value of land and additions on the property. | Land | Improvement |
|---|---|---|---|---|
| 2024 | $5,003 | $17,860 | $2,308 | $15,552 |
| 2023 | $4,851 | $17,860 | $2,308 | $15,552 |
| 2022 | $4,851 | $17,860 | $2,308 | $15,552 |
| 2021 | $4,204 | $13,872 | $1,509 | $12,363 |
| 2020 | $4,132 | $13,872 | $1,509 | $12,363 |
| 2019 | $4,163 | $15,533 | $1,509 | $14,024 |
| 2018 | $3,185 | $10,612 | $1,242 | $9,370 |
| 2017 | $3,135 | $10,612 | $1,242 | $9,370 |
| 2016 | $2,931 | $10,612 | $1,242 | $9,370 |
| 2015 | $2,817 | $9,416 | $1,153 | $8,263 |
| 2014 | $2,786 | $9,416 | $1,153 | $8,263 |
| 2013 | $2,715 | $9,416 | $1,153 | $8,263 |
Source: Public Records
Map
Nearby Homes
- 1662 Commodore Ct Unit 70294
- 1721 Chesapeake Ln Unit 4
- 1518 Harbour Ct Unit A1
- 1467 Fairlane Dr Unit 1B
- 1471 Fairlane Dr Unit 2A
- 1460 Fairlane Dr Unit 228
- 1463 Mercury Dr Unit 115
- 1463 Mercury Dr Unit 304
- 6908 Orchard Ln
- 1410 Brownstone Place Unit 38
- 7031 Glenwood Ln
- 1882 Keystone Place Unit 1882
- 6915 Hawthorne Ln
- 1102 Westover Ln Unit 1C
- 6938 Meadowbrook Ln
- 7468 Filmore Ave
- 6925 Edgebrook Ln
- 738 Crest Ave
- 1011 Mercury Dr Unit 7
- 664 Wedgewood Dr
- 1533 Commodore Ct Unit 70246
- 1533 Commodore Ct Unit 70247
- 1533 Commodore Ct Unit 70248
- 1533 Commodore Ct Unit 5
- 1533 Commodore Ct Unit 8
- 1529 Commodore Ct Unit 70242
- 1529 Commodore Ct Unit 70244
- 1529 Commodore Ct Unit 70243
- 1529 Commodore Ct Unit 70241
- 1529 Commodore Ct Unit 1
- 1614 Grove Ave Unit 2D1614
- 1614 Grove Ave Unit 2C1614
- 1614 Grove Ave Unit 2A1614
- 1614 Grove Ave Unit 2B1614
- 1614 Grove Ave Unit B
- 1614 Grove Ave Unit A
- 1620 Grove Ave Unit B
- 1620 Grove Ave Unit 2C1620
- 1620 Grove Ave Unit 2A1620
- 1620 Grove Ave Unit 2D1620