Estimated Value: $217,000 - $243,000
3
Beds
2
Baths
1,248
Sq Ft
$181/Sq Ft
Est. Value
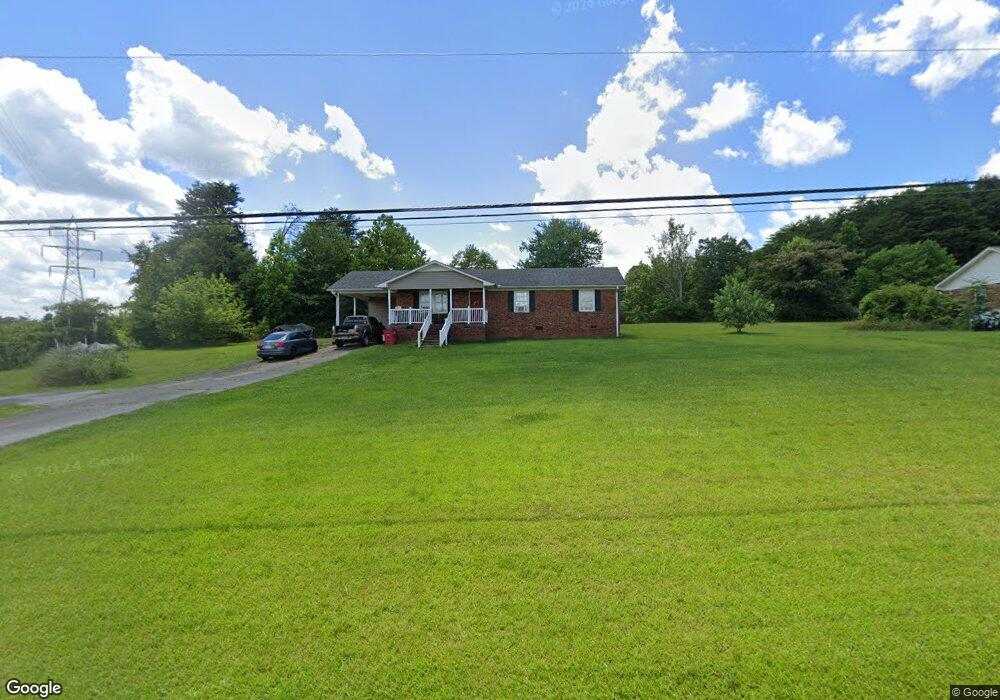
About This Home
This home is located at 1533 Compton Bridge Rd, Inman, SC 29349 and is currently estimated at $225,969, approximately $181 per square foot. 1533 Compton Bridge Rd is a home located in Spartanburg County with nearby schools including Inman Elementary School, T.E. Mabry Middle School, and Chapman High School.
Ownership History
Date
Name
Owned For
Owner Type
Purchase Details
Closed on
Nov 20, 2014
Sold by
Campbell Wesley M
Bought by
Duncan Evan Scott and Duncan Brooke Campbell
Current Estimated Value
Home Financials for this Owner
Home Financials are based on the most recent Mortgage that was taken out on this home.
Original Mortgage
$81,000
Outstanding Balance
$27,760
Interest Rate
4.16%
Mortgage Type
New Conventional
Estimated Equity
$198,209
Purchase Details
Closed on
Oct 24, 2006
Sold by
Perry Angela D
Bought by
Campbell Wesley M
Home Financials for this Owner
Home Financials are based on the most recent Mortgage that was taken out on this home.
Original Mortgage
$97,240
Interest Rate
6.27%
Mortgage Type
New Conventional
Purchase Details
Closed on
May 15, 2000
Sold by
Gillie Christopher R and Gillie Kristy J
Bought by
Perry Angela D
Create a Home Valuation Report for This Property
The Home Valuation Report is an in-depth analysis detailing your home's value as well as a comparison with similar homes in the area
Home Values in the Area
Average Home Value in this Area
Purchase History
| Date | Buyer | Sale Price | Title Company |
|---|---|---|---|
| Duncan Evan Scott | $90,000 | -- | |
| Campbell Wesley M | $100,740 | None Available | |
| Perry Angela D | $92,000 | -- |
Source: Public Records
Mortgage History
| Date | Status | Borrower | Loan Amount |
|---|---|---|---|
| Open | Duncan Evan Scott | $81,000 | |
| Closed | Campbell Wesley M | $97,240 |
Source: Public Records
Tax History
| Year | Tax Paid | Tax Assessment Tax Assessment Total Assessment is a certain percentage of the fair market value that is determined by local assessors to be the total taxable value of land and additions on the property. | Land | Improvement |
|---|---|---|---|---|
| 2025 | $918 | $4,904 | $1,010 | $3,894 |
| 2023 | $918 | $4,904 | $1,010 | $3,894 |
| 2022 | $829 | $4,264 | $796 | $3,468 |
| 2021 | $829 | $4,264 | $796 | $3,468 |
| 2020 | $813 | $4,264 | $796 | $3,468 |
| 2019 | $813 | $4,264 | $796 | $3,468 |
| 2018 | $813 | $4,264 | $796 | $3,468 |
| 2017 | $724 | $3,708 | $800 | $2,908 |
| 2016 | $724 | $3,708 | $800 | $2,908 |
| 2015 | $2,319 | $5,562 | $1,200 | $4,362 |
| 2014 | $701 | $3,708 | $800 | $2,908 |
Source: Public Records
Map
Nearby Homes
- 128 Cothran Rd
- 304 Shoreham Ln
- 119 Beechwood Dr
- 135 Glendarosa Dr
- 121 Hicks Dr
- 00 State Road S-42-371
- 255 Arena Park Dr
- 345 Bishop Hicks Ct
- 221 N Main St
- 3 Littlejohn St
- 473 Meadow Rd
- 342 Carramore Dr
- 314 Bellrock Rd
- 318 Bellrock Rd
- 310 Bellrock Rd
- 322 Bellrock Rd
- 155 Wingo St
- 304 Bellrock Rd
- 317 Bellrock Rd
- 329 Bellrock Rd
- 1543 Compton Bridge Rd
- 139 Wildflower Ln
- 1523 Compton Bridge Rd
- 133 Wildflower Ln
- 1553 Compton Bridge Rd
- 127 Wildflower Ln
- 1559 Compton Bridge Rd
- 0 Cothran Rd
- 121 Wildflower Ln
- 115 Wildflower Ln
- 1565 Compton Bridge Rd
- 0 Howard Gap Rd
- 109 Wildflower Ln
- 746 Windmill Hill Rd
- 756 Windmill Hill Rd
- 778 Windmill Hill Rd
- 730 Windmill Hill Rd
- 796 Windmill Hill Rd
- 736 Windmill Hill Rd
- 720 Windmill Hill Rd
Your Personal Tour Guide
Ask me questions while you tour the home.