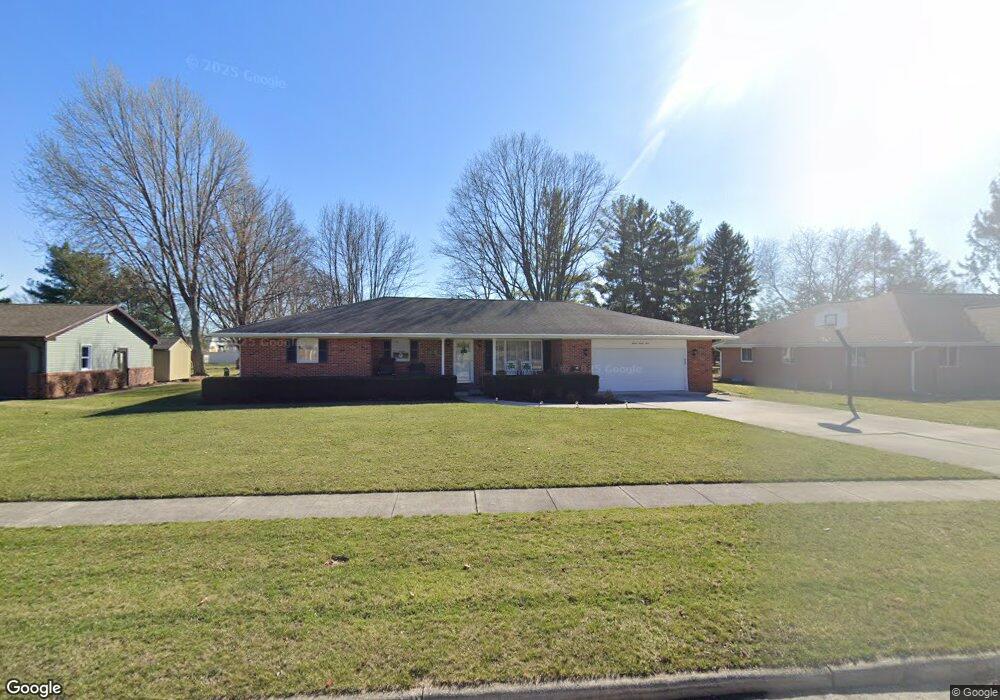
1533 Marcelle Ave Findlay, OH 45840
Estimated Value: $287,000 - $302,000
3
Beds
2
Baths
1,741
Sq Ft
$170/Sq Ft
Est. Value
About This Home
This home is located at 1533 Marcelle Ave, Findlay, OH 45840 and is currently estimated at $295,293, approximately $169 per square foot. 1533 Marcelle Ave is a home located in Hancock County with nearby schools including Wilson Vance Elementary School, Whittier Elementary School, and Donnell Middle School.
Ownership History
Date
Name
Owned For
Owner Type
Purchase Details
Closed on
May 1, 2002
Sold by
Young Julie A
Bought by
Guckes William N and Guckes Mary A
Current Estimated Value
Home Financials for this Owner
Home Financials are based on the most recent Mortgage that was taken out on this home.
Original Mortgage
$50,000
Interest Rate
7.18%
Mortgage Type
New Conventional
Purchase Details
Closed on
Feb 26, 2001
Sold by
Celebrezze John M
Bought by
Young Julie A
Home Financials for this Owner
Home Financials are based on the most recent Mortgage that was taken out on this home.
Original Mortgage
$116,800
Interest Rate
6.91%
Mortgage Type
New Conventional
Purchase Details
Closed on
Mar 30, 1983
Bought by
Celebrezze John M and Celebrezze Nancy
Create a Home Valuation Report for This Property
The Home Valuation Report is an in-depth analysis detailing your home's value as well as a comparison with similar homes in the area
Home Values in the Area
Average Home Value in this Area
Purchase History
| Date | Buyer | Sale Price | Title Company |
|---|---|---|---|
| Guckes William N | $146,500 | -- | |
| Young Julie A | $146,000 | -- | |
| Celebrezze John M | $75,000 | -- |
Source: Public Records
Mortgage History
| Date | Status | Borrower | Loan Amount |
|---|---|---|---|
| Previous Owner | Guckes William N | $50,000 | |
| Previous Owner | Young Julie A | $116,800 |
Source: Public Records
Tax History
| Year | Tax Paid | Tax Assessment Tax Assessment Total Assessment is a certain percentage of the fair market value that is determined by local assessors to be the total taxable value of land and additions on the property. | Land | Improvement |
|---|---|---|---|---|
| 2024 | $2,358 | $76,180 | $11,670 | $64,510 |
| 2023 | $2,384 | $76,180 | $11,670 | $64,510 |
| 2022 | $2,391 | $76,180 | $11,670 | $64,510 |
| 2021 | $2,211 | $63,070 | $11,230 | $51,840 |
| 2020 | $2,211 | $63,070 | $11,230 | $51,840 |
| 2019 | $2,167 | $63,070 | $11,230 | $51,840 |
| 2018 | $1,945 | $53,480 | $10,210 | $43,270 |
| 2017 | $1,945 | $53,480 | $10,210 | $43,270 |
| 2016 | $1,920 | $53,480 | $10,210 | $43,270 |
| 2015 | $2,407 | $63,780 | $10,840 | $52,940 |
| 2014 | $2,407 | $63,780 | $10,840 | $52,940 |
| 2012 | $2,423 | $63,780 | $10,840 | $52,940 |
Source: Public Records
Map
Nearby Homes
- 1421 E Sandusky St
- 1421 Autumn Dr
- 309 Huron Rd
- 1001 Decker Ave
- 401 Westchester Dr
- 1200 1st St
- 707 Winterhaven Dr
- 1037 Fishlock Ave
- 1521 Middle Ct
- 1825 Greendale Ave
- 1020 Country Club Dr
- 15591 Canadian Way
- 15586 Canadian Way
- 15615 Canadian Way
- 2000 Rush Creek Ct
- 1308 Greendale Ave
- 542 Bright Rd
- 1828 Queenswood Dr
- 439 Carnahan Ave
- 1926 Queenswood Dr
- 1529 Marcelle Ave
- 1537 Marcelle Ave
- 1530 Richard Ave
- 1536 Marcelle Ave
- 1541 Marcelle Ave
- 1540 Marcelle Ave
- 355 Rilla Rd
- 1525 Marcelle Ave
- 1532 Marcelle Ave
- 401 Rilla Rd
- 1545 Marcelle Ave
- 1528 Marcelle Ave
- 1533 Richard Ave
- 1539 E Main Cross St
- 1535 E Main Cross St
- 1553 Marcelle Ave
- 409 Rilla Rd
- 1531 E Main Cross St
- 1524 Marcelle Ave
- 348 Rilla Rd
Your Personal Tour Guide
Ask me questions while you tour the home.