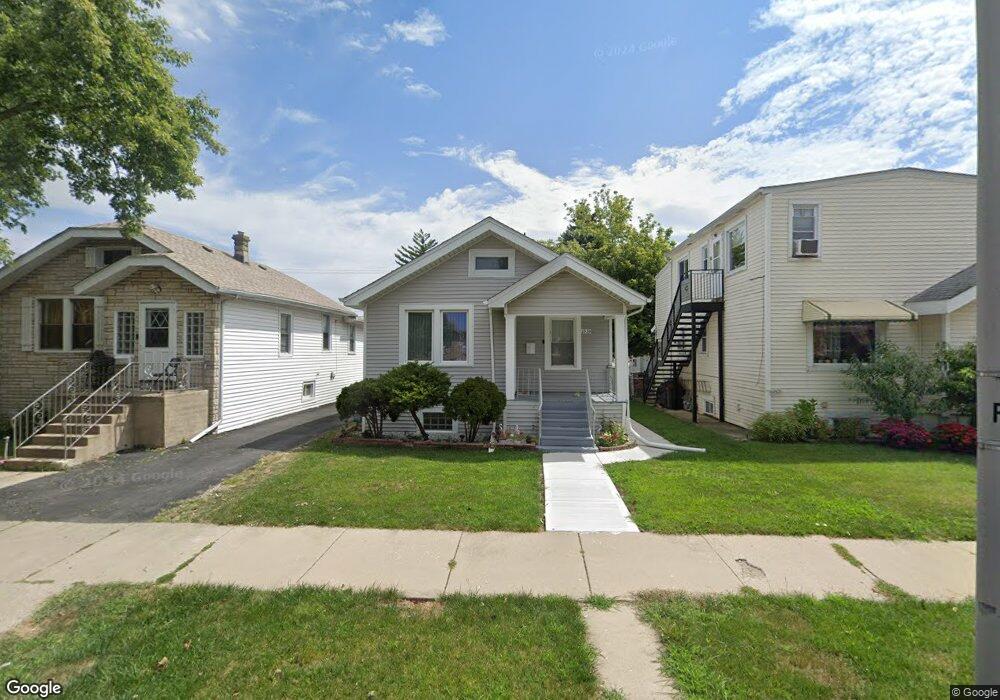
1533 N 15th Ave Melrose Park, IL 60160
Estimated Value: $287,000 - $313,000
3
Beds
2
Baths
932
Sq Ft
$325/Sq Ft
Est. Value
About This Home
This home is located at 1533 N 15th Ave, Melrose Park, IL 60160 and is currently estimated at $302,470, approximately $324 per square foot. 1533 N 15th Ave is a home located in Cook County with nearby schools including Jane Addams Elementary School, Stevenson Middle School, and Proviso East High School.
Ownership History
Date
Name
Owned For
Owner Type
Purchase Details
Closed on
Nov 21, 2005
Sold by
Favela Cecilia
Bought by
Florez Jesus
Current Estimated Value
Home Financials for this Owner
Home Financials are based on the most recent Mortgage that was taken out on this home.
Original Mortgage
$210,400
Outstanding Balance
$121,872
Interest Rate
6.99%
Mortgage Type
Unknown
Estimated Equity
$180,598
Purchase Details
Closed on
Jun 11, 2001
Sold by
Favela Cecilia
Bought by
Favela Alejandro H and Favela Cecilia
Home Financials for this Owner
Home Financials are based on the most recent Mortgage that was taken out on this home.
Original Mortgage
$143,560
Interest Rate
7.18%
Mortgage Type
FHA
Purchase Details
Closed on
Aug 16, 1999
Sold by
Kamide James A and Kamide Cynthia L
Bought by
Favela Cecilia
Home Financials for this Owner
Home Financials are based on the most recent Mortgage that was taken out on this home.
Original Mortgage
$113,825
Interest Rate
7.83%
Mortgage Type
FHA
Create a Home Valuation Report for This Property
The Home Valuation Report is an in-depth analysis detailing your home's value as well as a comparison with similar homes in the area
Home Values in the Area
Average Home Value in this Area
Purchase History
| Date | Buyer | Sale Price | Title Company |
|---|---|---|---|
| Florez Jesus | $263,000 | -- | |
| Favela Alejandro H | -- | Brokers Title Insurance Co | |
| Favela Cecilia | $114,000 | Professional National Title |
Source: Public Records
Mortgage History
| Date | Status | Borrower | Loan Amount |
|---|---|---|---|
| Open | Florez Jesus | $210,400 | |
| Previous Owner | Favela Alejandro H | $143,560 | |
| Previous Owner | Favela Cecilia | $113,825 |
Source: Public Records
Tax History Compared to Growth
Tax History
| Year | Tax Paid | Tax Assessment Tax Assessment Total Assessment is a certain percentage of the fair market value that is determined by local assessors to be the total taxable value of land and additions on the property. | Land | Improvement |
|---|---|---|---|---|
| 2024 | $5,027 | $20,180 | $3,982 | $16,198 |
| 2023 | $3,757 | $22,659 | $3,982 | $18,677 |
| 2022 | $3,757 | $15,612 | $3,444 | $12,168 |
| 2021 | $3,842 | $15,611 | $3,444 | $12,167 |
| 2020 | $3,805 | $15,611 | $3,444 | $12,167 |
| 2019 | $2,918 | $12,432 | $3,121 | $9,311 |
| 2018 | $3,304 | $13,664 | $3,121 | $10,543 |
| 2017 | $3,248 | $13,664 | $3,121 | $10,543 |
| 2016 | $2,866 | $11,440 | $2,798 | $8,642 |
| 2015 | $2,782 | $11,440 | $2,798 | $8,642 |
| 2014 | $2,712 | $11,440 | $2,798 | $8,642 |
| 2013 | $3,067 | $13,555 | $2,798 | $10,757 |
Source: Public Records
Map
Nearby Homes
- 1630 N 15th Ave
- 1209 Helen Dr
- 1202 Elsie Dr
- 1616 N 12th Ave
- 1718 N 15th Ave
- 923 Division St
- 1200 N 11th Ave
- 918 Park Dr
- 1724 N 19th Ave
- 1540 N 21st Ave
- 1114 N 11th Ave
- 1514 N 22nd Ave
- 1634 N 22nd Ave
- 1303 Rice St
- 1531 N 24th Ave
- 816 Augusta St
- 1710 N 23rd Ave
- 1815 N 22nd Ave
- 1418 N 24th Ave
- 1933 N 18th Ave
- 1535 N 15th Ave
- 1531 N 15th Ave
- 1537 N 15th Ave
- 1529 N 15th Ave
- 1525 N 15th Ave
- 1532 N 14th Ave
- 1536 N 14th Ave
- 1521 N 15th Ave
- 1528 N 14th Ave
- 1540 N 14th Ave
- 1601 N 15th Ave
- 1526 N 14th Ave
- 1530 N 15th Ave
- 1534 N 15th Ave
- 1528 N 15th Ave
- 1536 N 15th Ave
- 1524 N 15th Ave
- 1603 N 15th Ave
- 1522 N 14th Ave
- 1522 N 15th Ave