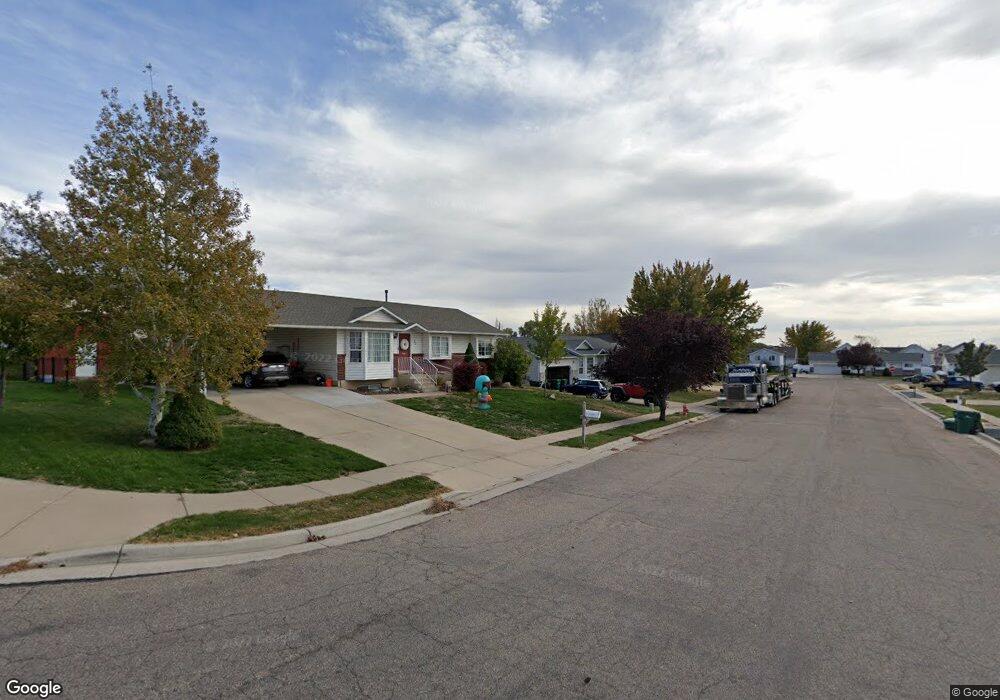
1533 N 300 W Clearfield, UT 84015
Estimated Value: $334,000 - $362,000
3
Beds
1
Bath
1,046
Sq Ft
$333/Sq Ft
Est. Value
About This Home
This home is located at 1533 N 300 W, Clearfield, UT 84015 and is currently estimated at $348,563, approximately $333 per square foot. 1533 N 300 W is a home located in Davis County with nearby schools including Sunset School, Sunset Junior High School, and Northridge High School.
Ownership History
Date
Name
Owned For
Owner Type
Purchase Details
Closed on
Jun 17, 2005
Sold by
Rosas Oscar
Bought by
Christensen Chad M and Christensen Nicole K
Current Estimated Value
Home Financials for this Owner
Home Financials are based on the most recent Mortgage that was taken out on this home.
Original Mortgage
$93,380
Outstanding Balance
$48,624
Interest Rate
5.72%
Mortgage Type
FHA
Estimated Equity
$299,939
Purchase Details
Closed on
May 16, 2005
Sold by
Rosas Oswaldo
Bought by
Rosas Oscar
Home Financials for this Owner
Home Financials are based on the most recent Mortgage that was taken out on this home.
Original Mortgage
$93,380
Outstanding Balance
$48,624
Interest Rate
5.72%
Mortgage Type
FHA
Estimated Equity
$299,939
Purchase Details
Closed on
Mar 4, 1998
Sold by
Nuttall Brian R and Nuttall Kimberly J
Bought by
Rosas Oscar and Rosas Oswaldo
Home Financials for this Owner
Home Financials are based on the most recent Mortgage that was taken out on this home.
Original Mortgage
$81,804
Interest Rate
6.99%
Mortgage Type
FHA
Create a Home Valuation Report for This Property
The Home Valuation Report is an in-depth analysis detailing your home's value as well as a comparison with similar homes in the area
Home Values in the Area
Average Home Value in this Area
Purchase History
| Date | Buyer | Sale Price | Title Company |
|---|---|---|---|
| Christensen Chad M | -- | Equity Title Ins Agency Inc | |
| Rosas Oscar | -- | Equity Title Ins Agency Inc | |
| Rosas Oscar | -- | Bonneville Title Company |
Source: Public Records
Mortgage History
| Date | Status | Borrower | Loan Amount |
|---|---|---|---|
| Open | Christensen Chad M | $93,380 | |
| Previous Owner | Rosas Oscar | $81,804 |
Source: Public Records
Tax History Compared to Growth
Tax History
| Year | Tax Paid | Tax Assessment Tax Assessment Total Assessment is a certain percentage of the fair market value that is determined by local assessors to be the total taxable value of land and additions on the property. | Land | Improvement |
|---|---|---|---|---|
| 2025 | $1,809 | $165,000 | $74,127 | $90,873 |
| 2024 | $1,778 | $162,250 | $70,855 | $91,395 |
| 2023 | $1,659 | $276,000 | $113,207 | $162,793 |
| 2022 | $1,772 | $159,501 | $64,763 | $94,738 |
| 2021 | $1,548 | $219,000 | $69,649 | $149,351 |
| 2020 | $1,250 | $174,000 | $58,743 | $115,257 |
| 2019 | $1,177 | $168,000 | $74,828 | $93,172 |
| 2018 | $1,045 | $146,000 | $59,799 | $86,201 |
| 2016 | $895 | $64,240 | $28,274 | $35,966 |
| 2015 | $856 | $58,245 | $28,274 | $29,971 |
| 2014 | $803 | $55,817 | $28,159 | $27,658 |
| 2013 | -- | $53,808 | $23,265 | $30,543 |
Source: Public Records
Map
Nearby Homes
- 1534 N 300 W
- 312 W 1425 N
- 1443 N 200 W
- 36 W 1600 N
- 1378 N 300 W
- 1438 N 475 W
- 1623 N 400 W
- 1696 N 475 W
- 31 W 1600 N
- 1721 N 400 W
- 1647 N Main St
- 1746 N 475 W
- 1874 N 200 W
- 1214 N 700 W
- 1974 N 75 W
- 52 W 2000 N
- 2085 N Main St Unit 409
- 2085 N Main St Unit 108
- 2085 N Main St Unit 401
- 2085 N Main St Unit 308