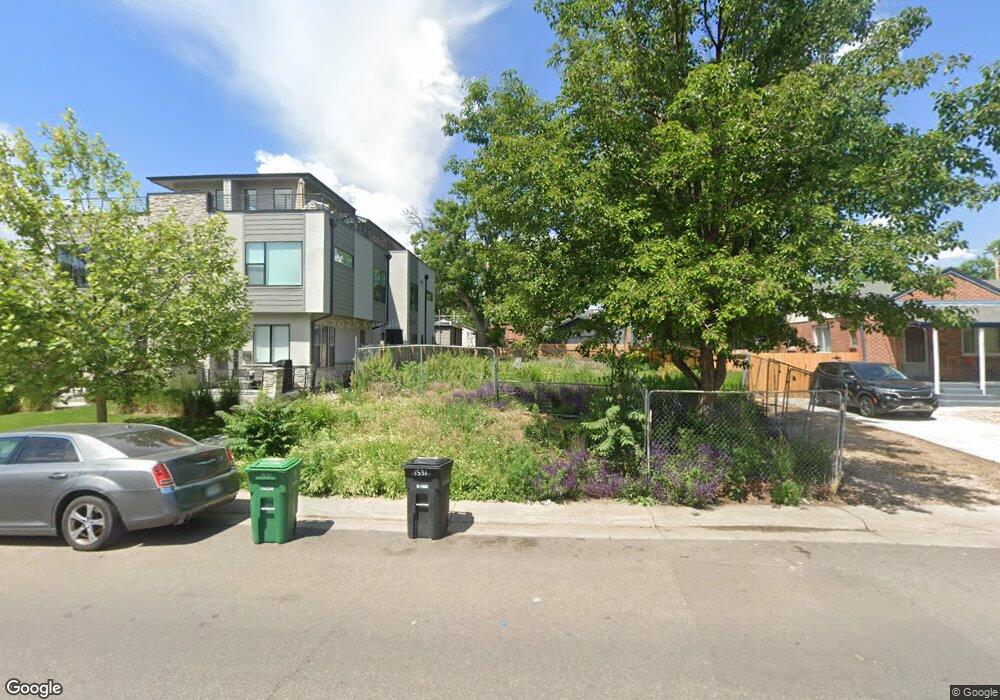
1533 Tennyson St Denver, CO 80204
West Colfax NeighborhoodEstimated Value: $335,000 - $673,199
2
Beds
3
Baths
963
Sq Ft
$531/Sq Ft
Est. Value
About This Home
This home is located at 1533 Tennyson St, Denver, CO 80204 and is currently estimated at $511,050, approximately $530 per square foot. 1533 Tennyson St is a home located in Denver County with nearby schools including Colfax Elementary School, Lake Middle School, and North High School.
Ownership History
Date
Name
Owned For
Owner Type
Purchase Details
Closed on
Nov 1, 2023
Sold by
1533 Tennyson Street Llc
Bought by
Abc House Llc
Current Estimated Value
Purchase Details
Closed on
Apr 20, 2021
Sold by
Dilday John
Bought by
1533 Tennyson Street Llc
Purchase Details
Closed on
Apr 15, 2021
Sold by
United Colorado Llc
Bought by
Dilday John
Purchase Details
Closed on
Jun 25, 2013
Sold by
Stow William R
Bought by
Stow William R
Purchase Details
Closed on
Mar 2, 2011
Sold by
Stow Megan E
Bought by
Stow William R
Purchase Details
Closed on
Dec 2, 2003
Sold by
Emergency Service Professional Physician
Bought by
Stow William R and Stow Megan E
Home Financials for this Owner
Home Financials are based on the most recent Mortgage that was taken out on this home.
Original Mortgage
$176,700
Interest Rate
5.94%
Mortgage Type
Purchase Money Mortgage
Create a Home Valuation Report for This Property
The Home Valuation Report is an in-depth analysis detailing your home's value as well as a comparison with similar homes in the area
Home Values in the Area
Average Home Value in this Area
Purchase History
| Date | Buyer | Sale Price | Title Company |
|---|---|---|---|
| Abc House Llc | -- | None Listed On Document | |
| Miramontes Carlos | -- | None Listed On Document | |
| 1533 Tennyson Street Llc | -- | None Available | |
| Dilday John | $610,000 | Land Title Guarantee Co | |
| United Colorado Llc | $560,000 | Land Title Guarantee Co | |
| Stow William R | -- | Fitco | |
| Stow William R | -- | None Available | |
| Stow William R | $186,000 | Empire Title & Escrow |
Source: Public Records
Mortgage History
| Date | Status | Borrower | Loan Amount |
|---|---|---|---|
| Previous Owner | Stow William R | $176,700 |
Source: Public Records
Tax History Compared to Growth
Tax History
| Year | Tax Paid | Tax Assessment Tax Assessment Total Assessment is a certain percentage of the fair market value that is determined by local assessors to be the total taxable value of land and additions on the property. | Land | Improvement |
|---|---|---|---|---|
| 2024 | $6,415 | $80,990 | $80,990 | -- |
| 2023 | $3,113 | $15,770 | $15,770 | -- |
| 2022 | $3,113 | $39,140 | $39,070 | $70 |
| 2021 | $3,005 | $40,270 | $40,200 | $70 |
| 2020 | $2,359 | $31,800 | $26,800 | $5,000 |
| 2019 | $2,293 | $31,800 | $26,800 | $5,000 |
| 2018 | $2,190 | $28,310 | $20,240 | $8,070 |
| 2017 | $2,184 | $28,310 | $20,240 | $8,070 |
| 2016 | $2,231 | $27,360 | $19,892 | $7,468 |
| 2015 | $2,138 | $27,360 | $19,892 | $7,468 |
| 2014 | $1,654 | $19,910 | $9,942 | $9,968 |
Source: Public Records
Map
Nearby Homes
- 1453 Utica St
- 1531 Vrain St
- 1569 Vrain St
- 1442 Stuart St
- 1495 Vrain St Unit 115
- 1477 Raleigh St
- 1596 S Stuart St
- 4200 W 17th Ave Unit 425
- 4200 W 17th Ave Unit 327
- 4200 W 17th Ave Unit 225
- 4200 W 17th Ave Unit 621
- 4200 W 17th Ave Unit 338
- 4200 W 17th Ave Unit 233
- 4200 W 17th Ave Unit 127
- 4200 W 17th Ave Unit 625
- 4200 W 17th Ave Unit 212
- 4200 W 17th Ave Unit 619
- 4200 W 17th Ave Unit 618
- 1568 Wolff St
- 1470 Wolff St Unit 109
- 1525 Tennyson St
- 1531 Tennyson St
- 1545 Tennyson St
- 1529 Tennyson St
- 1527 Tennyson St
- 1523 Tennyson St
- 1555 Tennyson St
- 1517 Tennyson St
- 1517 Tennyson St
- 1559 Tennyson St
- 1530 Utica St
- 1544 Utica St
- 1532 N Utica St
- 1538 Utica St
- 1540 Utica St
- 1565 Tennyson St
- 1550 Utica St
- 1558 Utica St
- 1575 Tennyson St
- 1574 Utica St