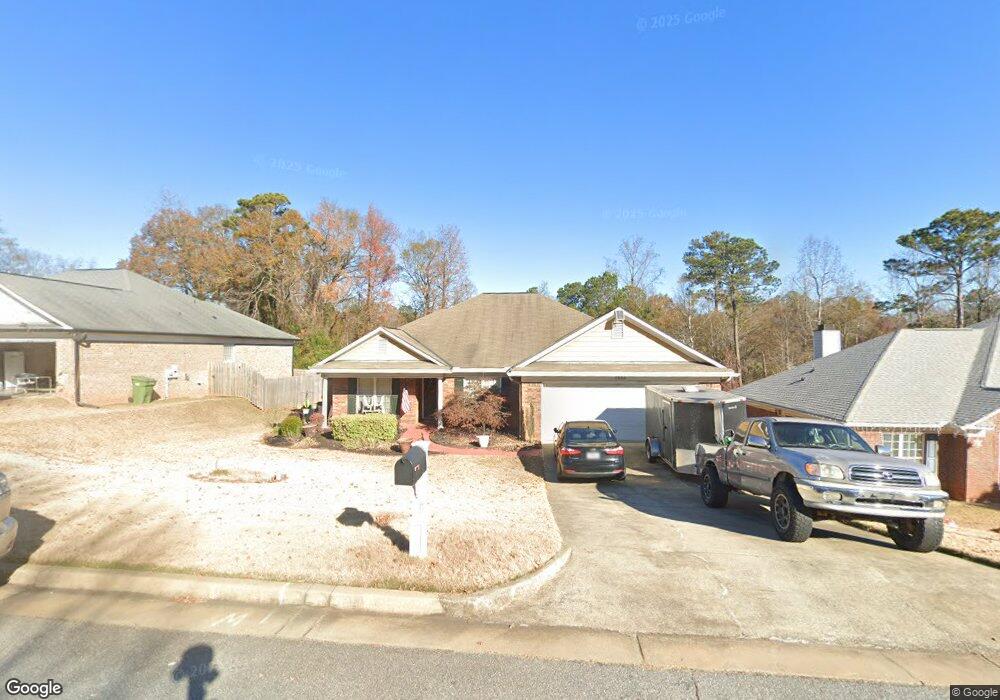
1533 Tom Buk Tu Ln Columbus, GA 31904
Northern Columbus NeighborhoodEstimated Value: $295,000 - $322,000
4
Beds
3
Baths
1,992
Sq Ft
$157/Sq Ft
Est. Value
About This Home
This home is located at 1533 Tom Buk Tu Ln, Columbus, GA 31904 and is currently estimated at $312,682, approximately $156 per square foot. 1533 Tom Buk Tu Ln is a home located in Muscogee County with nearby schools including Double Churches Elementary School, Double Churches Middle School, and Northside High School.
Ownership History
Date
Name
Owned For
Owner Type
Purchase Details
Closed on
Jan 16, 2015
Sold by
Hudson Kevin D
Bought by
Jenkins Leviticus D
Current Estimated Value
Home Financials for this Owner
Home Financials are based on the most recent Mortgage that was taken out on this home.
Original Mortgage
$193,285
Outstanding Balance
$148,266
Interest Rate
3.88%
Mortgage Type
VA
Estimated Equity
$164,416
Purchase Details
Closed on
May 6, 2014
Sold by
Dudewicz Douglas M
Bought by
Hudson Kevin D
Home Financials for this Owner
Home Financials are based on the most recent Mortgage that was taken out on this home.
Original Mortgage
$154,300
Interest Rate
3.13%
Mortgage Type
New Conventional
Purchase Details
Closed on
Apr 30, 2008
Sold by
Ray M Wright Inc
Bought by
Dudewicz Douglas M and Dudewicz Margot M
Home Financials for this Owner
Home Financials are based on the most recent Mortgage that was taken out on this home.
Original Mortgage
$229,300
Interest Rate
5.84%
Mortgage Type
VA
Create a Home Valuation Report for This Property
The Home Valuation Report is an in-depth analysis detailing your home's value as well as a comparison with similar homes in the area
Home Values in the Area
Average Home Value in this Area
Purchase History
| Date | Buyer | Sale Price | Title Company |
|---|---|---|---|
| Jenkins Leviticus D | $190,000 | -- | |
| Hudson Kevin D | $192,900 | -- | |
| Dudewicz Douglas M | $224,500 | None Available |
Source: Public Records
Mortgage History
| Date | Status | Borrower | Loan Amount |
|---|---|---|---|
| Open | Jenkins Leviticus D | $193,285 | |
| Previous Owner | Hudson Kevin D | $154,300 | |
| Previous Owner | Dudewicz Douglas M | $229,300 |
Source: Public Records
Tax History Compared to Growth
Tax History
| Year | Tax Paid | Tax Assessment Tax Assessment Total Assessment is a certain percentage of the fair market value that is determined by local assessors to be the total taxable value of land and additions on the property. | Land | Improvement |
|---|---|---|---|---|
| 2025 | $2,458 | $110,064 | $11,700 | $98,364 |
| 2024 | $2,458 | $110,064 | $11,700 | $98,364 |
| 2023 | $1,779 | $110,064 | $11,700 | $98,364 |
| 2022 | $2,563 | $86,428 | $11,700 | $74,728 |
| 2021 | $2,556 | $76,680 | $11,700 | $64,980 |
| 2020 | $2,557 | $76,680 | $11,700 | $64,980 |
| 2019 | $2,567 | $76,680 | $11,700 | $64,980 |
| 2018 | $2,567 | $76,680 | $11,700 | $64,980 |
| 2017 | $2,577 | $76,680 | $11,700 | $64,980 |
| 2016 | $2,588 | $76,000 | $16,960 | $59,040 |
| 2015 | $2,591 | $76,000 | $16,960 | $59,040 |
| 2014 | $3,158 | $89,615 | $16,960 | $72,655 |
| 2013 | -- | $89,615 | $16,960 | $72,655 |
Source: Public Records
Map
Nearby Homes
- 7185 Helen Dr
- 7131 Whitesville Rd
- 8008 Lagoon Ct
- 1355 Cloverdale Rd
- 6810 Fawndale Dr
- 6817 Whitesville Rd
- 6825 Ellis Dr
- 7313 Sesame St
- 6802 Ellis Dr
- 1440 Blanchfield Dr
- 1719 Double Churches Rd
- 6836 Sharmel Ln
- 7407 Peppercorn Dr
- 1438 Grove Park Dr Unit 8B
- 1438 Grove Park Dr Unit 13B
- 6969 Mobley Rd
- 7995 Big Creek Place
- 1255 Woodville Ct
- 18 Peppertree Ct
- 1049 Red Maple Way
- 1537 Tom Buk Tu Ln
- 1529 Tom Buk Tu Ln
- 1541 Tom Buk Tu Ln
- 1527 Tom Buk Tu Ln
- 74041 Ennis St
- 1538 Tom Buk Tu Ln
- 1532 Tom Buk Tu Ln
- 1530 Burrus Dr
- 7177 Helen Dr
- 1545 Tom Buk Tu Ln
- 1540 Tom Buk Tu Ln
- 1528 Tom Buk Tu Ln
- 1526 Burrus Dr
- 1525 Tom Buk Tu Ln
- 1524 Tom Buk Tu Ln
- 1551 Tom Buk Tu Ln
- 1522 Burrus Dr
- 1534 Burrus Dr
- 1521 Tom Buk Tu Ln
- 1520 Tom Buk Tu Ln