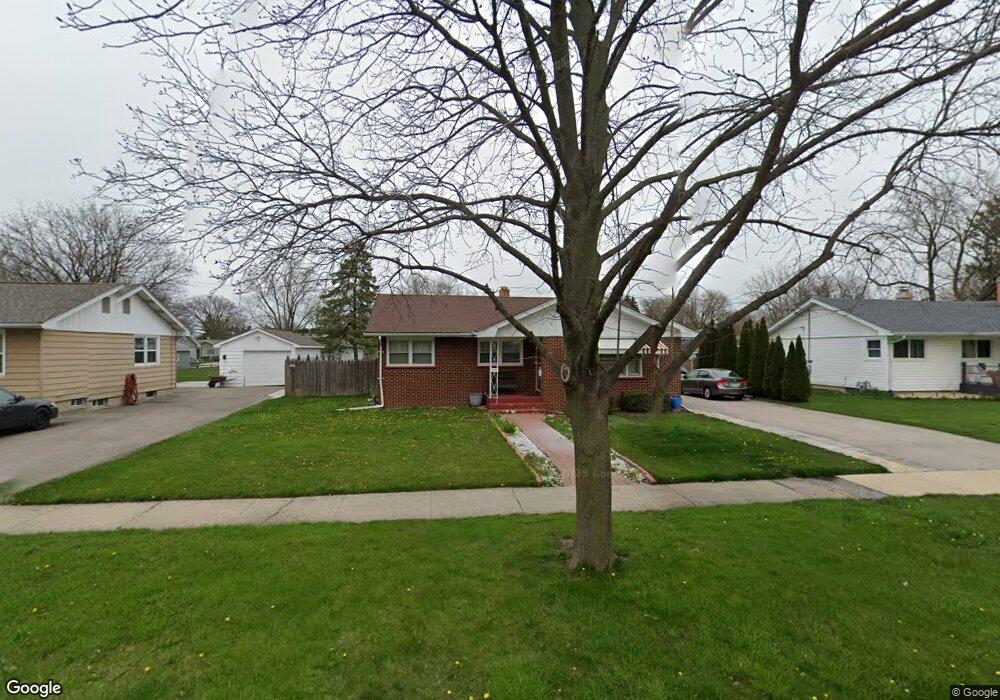
1533 W Illinois Ave Aurora, IL 60506
Edgelawn Randall NeighborhoodEstimated Value: $261,000 - $291,029
3
Beds
1
Bath
1,076
Sq Ft
$260/Sq Ft
Est. Value
About This Home
This home is located at 1533 W Illinois Ave, Aurora, IL 60506 and is currently estimated at $279,507, approximately $259 per square foot. 1533 W Illinois Ave is a home located in Kane County with nearby schools including Hall Elementary School, Jefferson Middle School, and West Aurora High School.
Ownership History
Date
Name
Owned For
Owner Type
Purchase Details
Closed on
Dec 11, 2001
Sold by
Franklin Rita S
Bought by
Briseno Jose L
Current Estimated Value
Home Financials for this Owner
Home Financials are based on the most recent Mortgage that was taken out on this home.
Original Mortgage
$137,063
Outstanding Balance
$53,359
Interest Rate
6.52%
Mortgage Type
FHA
Estimated Equity
$226,148
Purchase Details
Closed on
Nov 14, 1997
Sold by
Cartwright Bobby W and Cartwright June A
Bought by
Franklin Rita S
Home Financials for this Owner
Home Financials are based on the most recent Mortgage that was taken out on this home.
Original Mortgage
$65,000
Interest Rate
7.38%
Purchase Details
Closed on
Feb 23, 1996
Sold by
Schwerer Ronald G and Schwerer George E
Bought by
Cartwright Bobby W and Cartwright June A
Home Financials for this Owner
Home Financials are based on the most recent Mortgage that was taken out on this home.
Original Mortgage
$91,675
Interest Rate
7.07%
Create a Home Valuation Report for This Property
The Home Valuation Report is an in-depth analysis detailing your home's value as well as a comparison with similar homes in the area
Home Values in the Area
Average Home Value in this Area
Purchase History
| Date | Buyer | Sale Price | Title Company |
|---|---|---|---|
| Briseno Jose L | $139,000 | Chicago Title Insurance Co | |
| Franklin Rita S | $71,000 | Law Title Insurance Co Inc | |
| Cartwright Bobby W | $96,500 | Chicago Title Insurance Co |
Source: Public Records
Mortgage History
| Date | Status | Borrower | Loan Amount |
|---|---|---|---|
| Open | Briseno Jose L | $137,063 | |
| Previous Owner | Franklin Rita S | $65,000 | |
| Previous Owner | Cartwright Bobby W | $91,675 |
Source: Public Records
Tax History Compared to Growth
Tax History
| Year | Tax Paid | Tax Assessment Tax Assessment Total Assessment is a certain percentage of the fair market value that is determined by local assessors to be the total taxable value of land and additions on the property. | Land | Improvement |
|---|---|---|---|---|
| 2024 | $6,337 | $80,036 | $13,876 | $66,160 |
| 2023 | $6,125 | $71,512 | $12,398 | $59,114 |
| 2022 | $5,776 | $65,248 | $11,312 | $53,936 |
| 2021 | $5,550 | $60,747 | $10,532 | $50,215 |
| 2020 | $5,913 | $63,160 | $9,783 | $53,377 |
| 2019 | $5,722 | $58,519 | $9,064 | $49,455 |
| 2018 | $5,307 | $53,163 | $8,384 | $44,779 |
| 2017 | $4,887 | $47,487 | $7,725 | $39,762 |
| 2016 | $5,025 | $47,301 | $6,622 | $40,679 |
| 2015 | -- | $41,450 | $5,694 | $35,756 |
| 2014 | -- | $38,513 | $5,233 | $33,280 |
| 2013 | -- | $39,057 | $5,158 | $33,899 |
Source: Public Records
Map
Nearby Homes
- 630 N Buell Ave
- 1747 W Illinois Ave
- 833 N Randall Rd Unit C4
- 1389 Monomoy St Unit B2
- 972 Westgate Dr
- 1735 Greene Ct
- 1751 Greene Ct
- 113 Stonewood Place Unit 6D
- 1351 Monomoy St Unit D
- 1390 N Glen Cir Unit B
- 1035 Newcastle Ln
- 1730 W Galena Blvd Unit 402E
- 1543 W Downer Place
- 231 W Downer Place
- 1104 New Haven Ave
- 1149 Newcastle Ln
- 1296 Yellowpine Dr
- 865 N Fordham Ave
- 960 Sapphire Ln
- 964 Sapphire Ln
- 1529 W Illinois Ave
- 1539 W Illinois Ave
- 1532 Roanoke Ave
- 1521 W Illinois Ave
- 1545 W Illinois Ave
- 1538 Roanoke Ave
- 1526 Roanoke Ave
- 1544 Roanoke Ave
- 1520 Roanoke Ave
- 1534 W Illinois Ave
- 1528 W Illinois Ave
- 1515 W Illinois Ave
- 1551 W Illinois Ave
- 1540 W Illinois Ave
- 1548 Roanoke Ave
- 1516 Roanoke Ave
- 1555 W Illinois Ave
- 661 N Buell Ave
- 635 N Western Ave
- 632 N Buell Ave