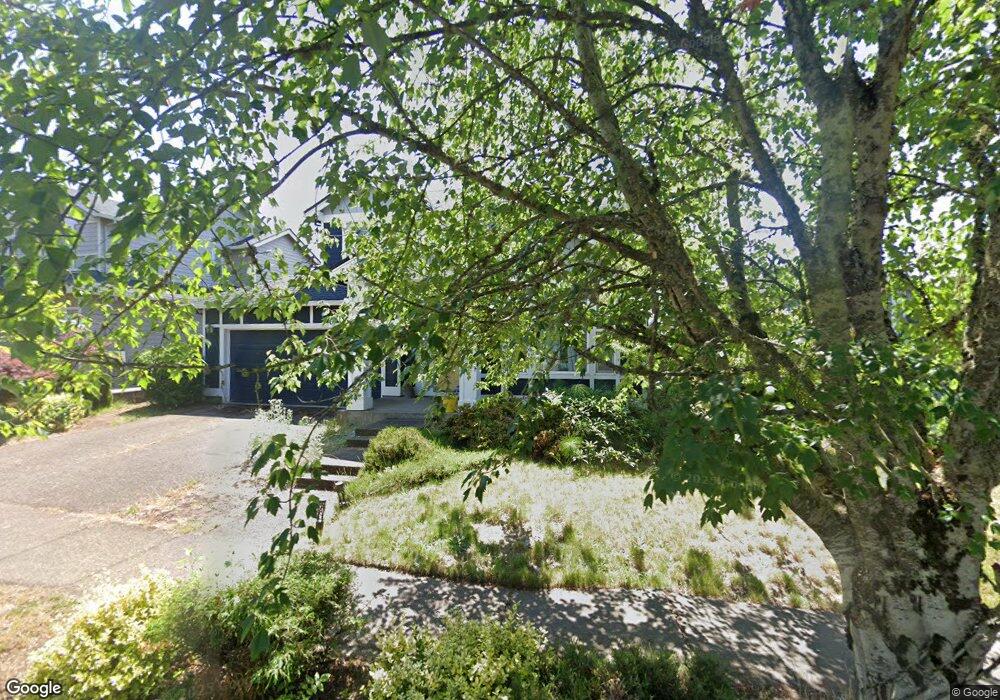
15330 SE Honeysuckle Way Clackamas, OR 97015
Rock Creek NeighborhoodEstimated Value: $490,644 - $579,000
3
Beds
3
Baths
1,636
Sq Ft
$324/Sq Ft
Est. Value
About This Home
This home is located at 15330 SE Honeysuckle Way, Clackamas, OR 97015 and is currently estimated at $529,411, approximately $323 per square foot. 15330 SE Honeysuckle Way is a home located in Clackamas County with nearby schools including Oregon Trail Elementary School, Rock Creek Middle School, and Clackamas High School.
Ownership History
Date
Name
Owned For
Owner Type
Purchase Details
Closed on
Jul 1, 2022
Sold by
Nguyen Viet T and Nguyen Phianh
Bought by
Nguyen Viet T and Nguyen Hannah
Current Estimated Value
Home Financials for this Owner
Home Financials are based on the most recent Mortgage that was taken out on this home.
Original Mortgage
$262,524
Outstanding Balance
$249,793
Interest Rate
5.27%
Mortgage Type
Balloon
Estimated Equity
$279,618
Purchase Details
Closed on
Jul 24, 2019
Sold by
Nguyen Viet T
Bought by
Nguyen Viet T and Nguyen Phianh
Purchase Details
Closed on
Jul 17, 2003
Sold by
Orduno Ralph F and Orduno Dolores T
Bought by
Le Huong Thi
Purchase Details
Closed on
Apr 8, 1997
Sold by
Oregon Trails Llc
Bought by
Orduno Ralph F and Orduno Dolores T
Home Financials for this Owner
Home Financials are based on the most recent Mortgage that was taken out on this home.
Original Mortgage
$127,150
Interest Rate
7.66%
Create a Home Valuation Report for This Property
The Home Valuation Report is an in-depth analysis detailing your home's value as well as a comparison with similar homes in the area
Home Values in the Area
Average Home Value in this Area
Purchase History
| Date | Buyer | Sale Price | Title Company |
|---|---|---|---|
| Nguyen Viet T | $250,000 | Bourne Kerry-Frances | |
| Nguyen Viet T | -- | None Available | |
| Le Huong Thi | $172,500 | -- | |
| Orduno Ralph F | $158,990 | Chicago Title Insurance Co |
Source: Public Records
Mortgage History
| Date | Status | Borrower | Loan Amount |
|---|---|---|---|
| Open | Nguyen Viet T | $262,524 | |
| Previous Owner | Orduno Ralph F | $127,150 |
Source: Public Records
Tax History Compared to Growth
Tax History
| Year | Tax Paid | Tax Assessment Tax Assessment Total Assessment is a certain percentage of the fair market value that is determined by local assessors to be the total taxable value of land and additions on the property. | Land | Improvement |
|---|---|---|---|---|
| 2025 | $5,472 | $284,257 | -- | -- |
| 2024 | $5,281 | $275,978 | -- | -- |
| 2023 | $5,281 | $267,940 | $0 | $0 |
| 2022 | $4,862 | $260,136 | $0 | $0 |
| 2021 | $4,688 | $252,560 | $0 | $0 |
| 2020 | $4,534 | $245,204 | $0 | $0 |
| 2019 | $4,482 | $238,063 | $0 | $0 |
| 2018 | $3,932 | $231,129 | $0 | $0 |
| 2017 | $3,810 | $224,397 | $0 | $0 |
| 2016 | $3,679 | $217,861 | $0 | $0 |
| 2015 | $3,577 | $211,516 | $0 | $0 |
| 2014 | $3,367 | $205,355 | $0 | $0 |
Source: Public Records
Map
Nearby Homes
- 15446 SE Honeysuckle Way
- 13052 SE Meadehill Ave
- 13061 SE Meadehill Ave
- 14920 SE Shaunte Ln
- 15378 SE Parktree Dr
- 15680 SE Vivian Way
- 13634 SE 149th Terrace
- 12942 SE 155th Ave
- 12818 SE Meadehill Ave
- 12843 SE 155th Ave
- 14920 SE Page Park Ct
- 14815 SE Donley Ln
- 15688 SE Misty Dr
- 15833 SE Wood Duck Ln
- 12674 SE Meadehill Ave
- 12762 SE 157th Ave
- 14822 SE Natalya St
- 14997 SE Gilesford St
- 15193 SE Brackenbush Rd
- 15864 SE Chelsea Morning Dr
- 13476 SE 153rd Dr
- 15392 SE Honeysuckle Way
- 15373 SE Daffodil Place
- 13494 SE 153rd Dr
- 15424 SE Honeysuckle Way
- 15419 SE Daffodil Place
- 15333 SE Honeysuckle Way
- 15401 SE Daffodil Place
- 15391 SE Honeysuckle Way
- 15415 SE Honeysuckle Way
- 15437 SE Daffodil Place
- 15429 SE Honeysuckle Way
- 15455 SE Daffodil Place
- 13504 SE 152nd Dr
- 13504 SE 152nd Dr
- 13540 SE 153rd Dr
- 13545 SE 154th Dr
- 15460 SE Honeysuckle Way
- 15447 SE Honeysuckle Way
- 15404 SE Daffodil Place