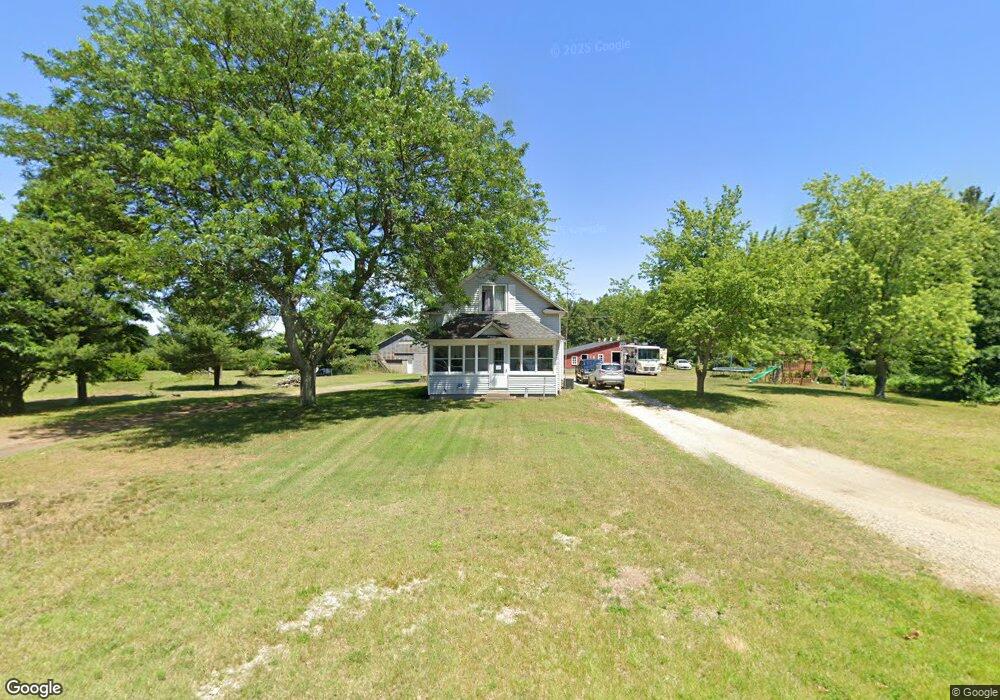
15331 Quincy St Holland, MI 49424
Estimated Value: $394,062 - $454,000
2
Beds
1
Bath
1,207
Sq Ft
$353/Sq Ft
Est. Value
About This Home
This home is located at 15331 Quincy St, Holland, MI 49424 and is currently estimated at $426,016, approximately $352 per square foot. 15331 Quincy St is a home located in Ottawa County with nearby schools including Lakeshore Elementary School, Westport K-8 School, and Harbor Lights Middle School.
Ownership History
Date
Name
Owned For
Owner Type
Purchase Details
Closed on
Apr 11, 2017
Sold by
Oosterink Cook Llc
Bought by
Vankampen William and Vankampen Sara
Current Estimated Value
Home Financials for this Owner
Home Financials are based on the most recent Mortgage that was taken out on this home.
Original Mortgage
$217,134
Outstanding Balance
$185,938
Interest Rate
5.5%
Mortgage Type
FHA
Estimated Equity
$240,078
Purchase Details
Closed on
Feb 2, 2015
Sold by
Oosterink Cook Llc
Bought by
Vankampen William and Vankampen Sara
Purchase Details
Closed on
Jan 24, 2005
Sold by
Oosterink Nancy L and Cook Joni F
Bought by
Oosterink Cook Llc
Create a Home Valuation Report for This Property
The Home Valuation Report is an in-depth analysis detailing your home's value as well as a comparison with similar homes in the area
Home Values in the Area
Average Home Value in this Area
Purchase History
| Date | Buyer | Sale Price | Title Company |
|---|---|---|---|
| Vankampen William | $210,000 | Lighthouse Title Inc | |
| Vankampen William | -- | Lighthouse Title Inc | |
| Oosterink Cook Llc | -- | -- |
Source: Public Records
Mortgage History
| Date | Status | Borrower | Loan Amount |
|---|---|---|---|
| Open | Vankampen William | $217,134 |
Source: Public Records
Tax History Compared to Growth
Tax History
| Year | Tax Paid | Tax Assessment Tax Assessment Total Assessment is a certain percentage of the fair market value that is determined by local assessors to be the total taxable value of land and additions on the property. | Land | Improvement |
|---|---|---|---|---|
| 2025 | $3,387 | $187,000 | $0 | $0 |
| 2024 | $2,679 | $150,100 | $0 | $0 |
| 2023 | $2,585 | $127,000 | $0 | $0 |
| 2022 | $3,205 | $119,600 | $0 | $0 |
| 2021 | $3,133 | $114,000 | $0 | $0 |
| 2020 | $3,000 | $104,500 | $0 | $0 |
| 2019 | $2,897 | $95,700 | $0 | $0 |
| 2018 | $2,884 | $96,500 | $0 | $0 |
| 2017 | $2,838 | $96,500 | $0 | $0 |
| 2016 | $2,990 | $102,900 | $0 | $0 |
| 2015 | -- | $101,100 | $0 | $0 |
| 2014 | -- | $101,600 | $0 | $0 |
Source: Public Records
Map
Nearby Homes
- 3611 Butternut Dr Unit 167
- 15877 Fendt Farm Rd
- The Balsam Plan at Macatawa Legends - Single Family Homes
- The Wisteria Plan at Macatawa Legends - Single Family Homes
- The Preston Plan at Macatawa Legends - Single Family Homes
- The Hadley Plan at Macatawa Legends - Single Family Homes
- The Sanibel Plan at Macatawa Legends - Single Family Homes
- The Fitzgerald Plan at Macatawa Legends - Single Family Homes
- The Jamestown Plan at Macatawa Legends - Single Family Homes
- The Bay Harbor II Plan at Macatawa Legends - Single Family Homes
- The Mackinaw Plan at Macatawa Legends - Single Family Homes
- The Hearthside Plan at Macatawa Legends - Single Family Homes
- The Sebastian Plan at Macatawa Legends - Single Family Homes
- The Grayson Plan at Macatawa Legends - Single Family Homes
- The Windsor Plan at Macatawa Legends - Single Family Homes
- The Garland Plan at Macatawa Legends - Single Family Homes
- The Maxwell Plan at Macatawa Legends - Single Family Homes
- The Marley Plan at Macatawa Legends - Single Family Homes
- The Bristol Plan at Macatawa Legends - Single Family Homes
- The Newport Plan at Macatawa Legends - Single Family Homes
- 15441 Quincy St
- 15364 Quincy St
- 15289 Quincy St
- 15285 Quincy St
- 15540 Quincy St
- 15551 Quincy St
- 15396 Ransom St
- 3777 152nd Ave
- 15071 Quincy St
- 15597 Quincy St
- 3975 Butternut Dr
- 4200 152nd Ave
- 4142 Butternut Dr
- 4184 Butternut Dr
- 3911 Butternut Dr
- 0 Butternut Dr
- 14960 Quincy St
- 3936 Butternut Dr
- 14955 Quincy St
- 15615 Quincy St