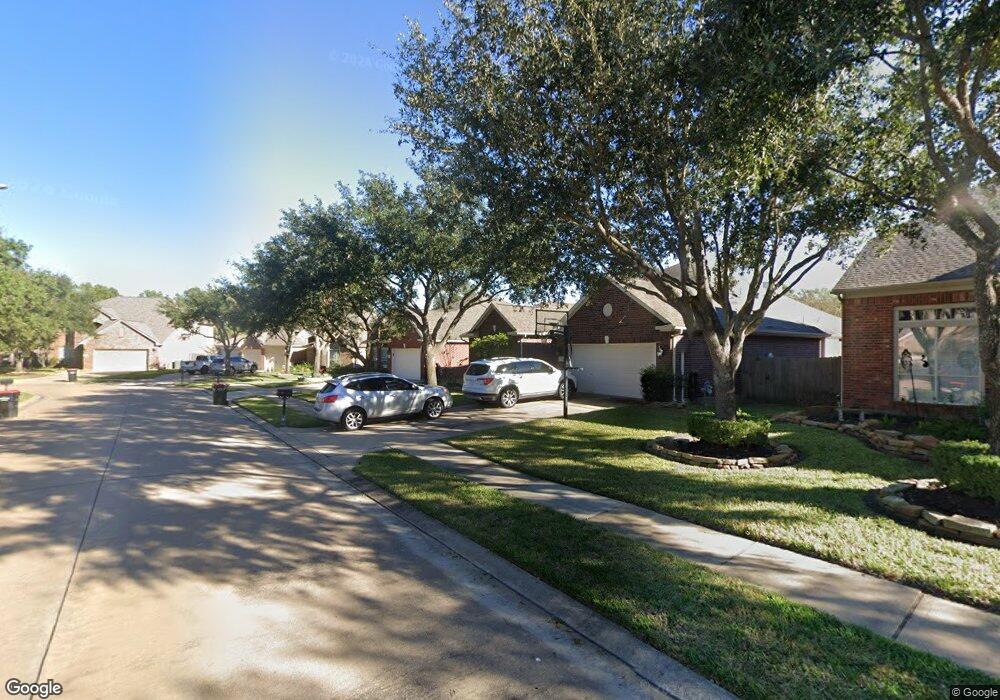
15334 Bent Twig Way Cypress, TX 77433
Fairfield Village NeighborhoodEstimated Value: $341,000 - $361,000
3
Beds
2
Baths
2,144
Sq Ft
$164/Sq Ft
Est. Value
About This Home
This home is located at 15334 Bent Twig Way, Cypress, TX 77433 and is currently estimated at $352,220, approximately $164 per square foot. 15334 Bent Twig Way is a home located in Harris County with nearby schools including Keith Elementary School, Salyards Middle, and Bridgeland High School.
Ownership History
Date
Name
Owned For
Owner Type
Purchase Details
Closed on
Mar 27, 2020
Sold by
Leigh Karen T
Bought by
Jones John Tyler and Bush Jessica Leighanne
Current Estimated Value
Home Financials for this Owner
Home Financials are based on the most recent Mortgage that was taken out on this home.
Original Mortgage
$225,000
Outstanding Balance
$199,323
Interest Rate
3.4%
Mortgage Type
New Conventional
Estimated Equity
$152,897
Purchase Details
Closed on
Mar 10, 2007
Sold by
Chen Meijin and Wang Jianlin
Bought by
Leigh Karen T
Purchase Details
Closed on
Feb 24, 2003
Sold by
Lennar Homes Of Texas Inc
Bought by
Wang Jianlin and Chen Meijin
Home Financials for this Owner
Home Financials are based on the most recent Mortgage that was taken out on this home.
Original Mortgage
$120,000
Interest Rate
5.86%
Create a Home Valuation Report for This Property
The Home Valuation Report is an in-depth analysis detailing your home's value as well as a comparison with similar homes in the area
Home Values in the Area
Average Home Value in this Area
Purchase History
| Date | Buyer | Sale Price | Title Company |
|---|---|---|---|
| Jones John Tyler | -- | Fidelity National Title | |
| Leigh Karen T | -- | Chicago Title Cypress | |
| Wang Jianlin | -- | North American Title Co | |
| Lennar Homes Of Texas Sales & Mktg Ltd | -- | North American Title Co |
Source: Public Records
Mortgage History
| Date | Status | Borrower | Loan Amount |
|---|---|---|---|
| Open | Jones John Tyler | $225,000 | |
| Previous Owner | Wang Jianlin | $120,000 |
Source: Public Records
Tax History Compared to Growth
Tax History
| Year | Tax Paid | Tax Assessment Tax Assessment Total Assessment is a certain percentage of the fair market value that is determined by local assessors to be the total taxable value of land and additions on the property. | Land | Improvement |
|---|---|---|---|---|
| 2025 | $6,176 | $334,559 | $76,076 | $258,483 |
| 2024 | $6,176 | $330,000 | $76,076 | $253,924 |
| 2023 | $6,176 | $339,518 | $76,076 | $263,442 |
| 2022 | $6,775 | $305,954 | $69,297 | $236,657 |
| 2021 | $6,502 | $248,554 | $69,297 | $179,257 |
| 2020 | $6,225 | $229,750 | $43,311 | $186,439 |
| 2019 | $6,311 | $224,552 | $34,272 | $190,280 |
| 2018 | $912 | $209,209 | $34,272 | $174,937 |
| 2017 | $5,955 | $209,209 | $34,272 | $174,937 |
| 2016 | $5,701 | $200,292 | $34,272 | $166,020 |
| 2015 | $2,347 | $200,292 | $34,272 | $166,020 |
| 2014 | $2,347 | $173,704 | $34,272 | $139,432 |
Source: Public Records
Map
Nearby Homes
- 15403 Court Green Trail
- 15334 Sienna Oak Dr
- 11018 White Caterpillar Dr
- 15326 Wild Timber Trail
- 16018 Lower Lake Dr
- 15122 Blue Thistle Dr
- 15311 Redbud Berry Way
- 22015 Bronze Leaf Dr
- 15318 Redbud Berry Way
- 20807 Twisted Leaf Dr
- 20803 Twisted Leaf Dr
- 21702 E Mulberry Field Cir
- 20815 Golden Sycamore Trail
- 20906 Ochre Willow Trail
- 16407 Thyme Green Ln
- 15127 Turquoise Mist Dr
- 15503 Fairfield Falls Way
- 15007 Wildberry Creek Ct
- 20622 Tulip Blossom Ct
- 21511 Amber Grain Ln
- 15330 Bent Twig Way
- 15338 Bent Twig Way
- 15411 Court Green Trail
- 15407 Court Green Trail
- 15326 Bent Twig Way
- 15435 Turning Tree Way
- 15335 Court Green Trail
- 15415 Court Green Trail
- 15335 Bent Twig Way
- 15331 Bent Twig Way
- 15322 Bent Twig Way
- 15331 Court Green Trail
- 15431 Turning Tree Way
- 15327 Bent Twig Way
- 15419 Court Green Trail
- 15327 Court Green Trail
- 15318 Bent Twig Way
- 15323 Bent Twig Way
- 15427 Turning Tree Way
- 15414 Court Green Trail