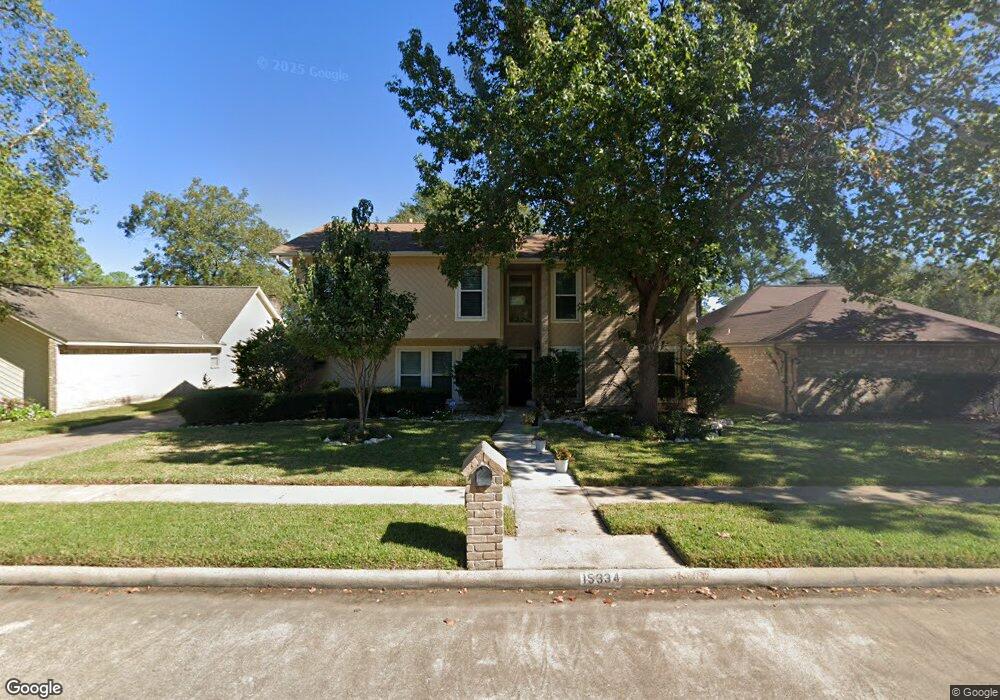
15334 Glenwood Park Dr Houston, TX 77095
Copperfield NeighborhoodEstimated Value: $301,801 - $339,000
4
Beds
3
Baths
2,342
Sq Ft
$135/Sq Ft
Est. Value
About This Home
This home is located at 15334 Glenwood Park Dr, Houston, TX 77095 and is currently estimated at $315,700, approximately $134 per square foot. 15334 Glenwood Park Dr is a home located in Harris County with nearby schools including Fiest Elementary School, Labay Middle School, and Cypress Falls High School.
Ownership History
Date
Name
Owned For
Owner Type
Purchase Details
Closed on
May 24, 2024
Sold by
Smith Linda K
Bought by
Linda K Smith Revocable Trust and Smith
Current Estimated Value
Purchase Details
Closed on
Aug 8, 2019
Sold by
Smith Linda K
Bought by
Smith Linda K and Linda K Smith Revocabel Trust
Purchase Details
Closed on
Jun 29, 1999
Sold by
Chou Nory T and Chou Wendy W
Bought by
Smith Linda
Home Financials for this Owner
Home Financials are based on the most recent Mortgage that was taken out on this home.
Original Mortgage
$88,315
Interest Rate
7.21%
Purchase Details
Closed on
Sep 19, 1995
Sold by
Nash Ernest George and Nash Donna Rae
Bought by
Nash Darrel Ray and Nash Sheryl Loraine
Home Financials for this Owner
Home Financials are based on the most recent Mortgage that was taken out on this home.
Original Mortgage
$73,150
Interest Rate
7.77%
Mortgage Type
Assumption
Create a Home Valuation Report for This Property
The Home Valuation Report is an in-depth analysis detailing your home's value as well as a comparison with similar homes in the area
Home Values in the Area
Average Home Value in this Area
Purchase History
| Date | Buyer | Sale Price | Title Company |
|---|---|---|---|
| Linda K Smith Revocable Trust | -- | None Listed On Document | |
| Smith Linda K | -- | None Available | |
| Smith Linda | -- | Regency Title | |
| Nash Darrel Ray | -- | Texas American Title Company |
Source: Public Records
Mortgage History
| Date | Status | Borrower | Loan Amount |
|---|---|---|---|
| Previous Owner | Smith Linda | $88,315 | |
| Previous Owner | Nash Darrel Ray | $73,150 | |
| Closed | Smith Linda | $5,195 |
Source: Public Records
Tax History Compared to Growth
Tax History
| Year | Tax Paid | Tax Assessment Tax Assessment Total Assessment is a certain percentage of the fair market value that is determined by local assessors to be the total taxable value of land and additions on the property. | Land | Improvement |
|---|---|---|---|---|
| 2025 | $1,406 | $283,633 | $74,624 | $209,009 |
| 2024 | $1,406 | $272,102 | $74,624 | $197,478 |
| 2023 | $1,406 | $304,868 | $74,624 | $230,244 |
| 2022 | $5,406 | $248,985 | $53,303 | $195,682 |
| 2021 | $5,188 | $198,229 | $53,303 | $144,926 |
| 2020 | $5,210 | $192,445 | $44,419 | $148,026 |
| 2019 | $5,101 | $182,967 | $26,651 | $156,316 |
| 2018 | $1,020 | $175,823 | $26,651 | $149,172 |
| 2017 | $4,903 | $175,823 | $26,651 | $149,172 |
| 2016 | $4,633 | $175,823 | $26,651 | $149,172 |
| 2015 | $3,121 | $153,650 | $26,651 | $126,999 |
| 2014 | $3,121 | $137,290 | $26,651 | $110,639 |
Source: Public Records
Map
Nearby Homes
- 15339 Glenwood Park Dr
- 8211 Riverglade Dr
- 15611 Meadow Village Dr
- 15415 Swan Creek Dr
- 15362 Meadow Village Dr
- 15010 Chetland Place Dr
- 15414 Swan Creek Dr
- 8203 Green Devon Dr
- 15131 New Hastings Dr
- 14919 Forest Trails Dr
- 14962 Royal Birkdale St
- 15634 Haleys Landing Ln
- 14931 Inverrary Dr
- 8526 Greenleaf Lake Dr
- 15610 Tarpon Springs Ct
- Highway 6 N & Huffmeister Rd
- 15918 Pinyon Creek Dr
- 7827 Alamar Dr
- 15610 Manorford Ct
- 14911 Sandalfoot St
- 15338 Glenwood Park Dr
- 15330 Glenwood Park Dr
- 15223 Windy Cove Dr
- 15219 Windy Cove Dr
- 15342 Glenwood Park Dr
- 15326 Glenwood Park Dr
- 15227 Windy Cove Dr
- 15215 Windy Cove Dr
- 15335 Glenwood Park Dr
- 15331 Glenwood Park Dr
- 15231 Windy Cove Dr
- 15346 Glenwood Park Dr
- 15327 Glenwood Park Dr
- 15343 Glenwood Park Dr
- 15211 Windy Cove Dr
- 15322 Glenwood Park Dr
- 15303 Windy Cove Dr
- 15347 Glenwood Park Dr
- 15318 Sterling Lake Dr
- 15350 Glenwood Park Dr