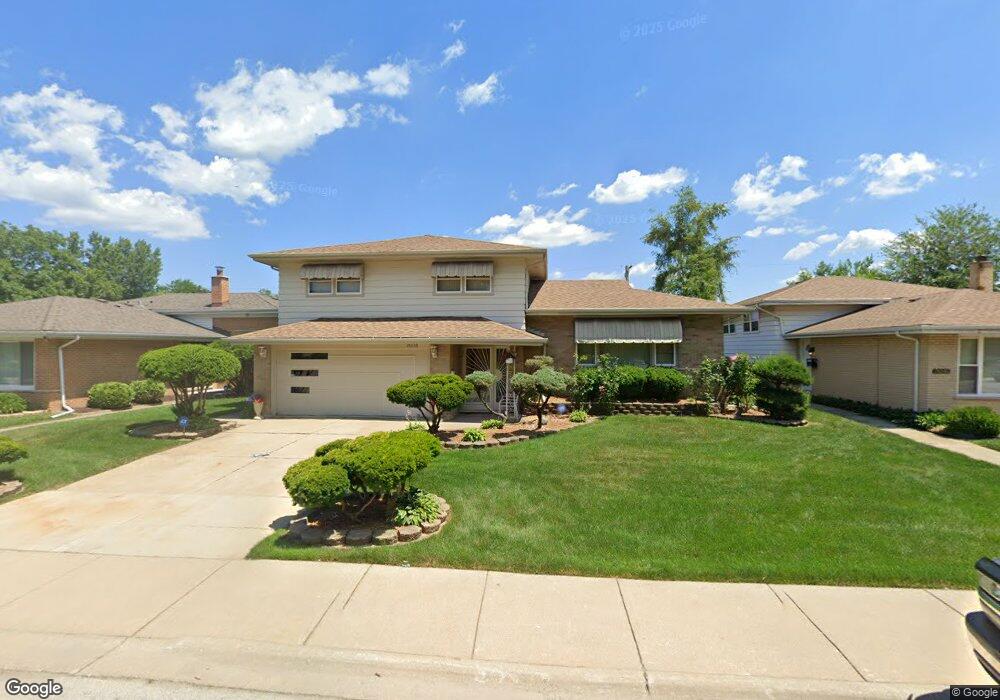
15335 Dobson Ave South Holland, IL 60473
Estimated Value: $237,000 - $270,000
4
Beds
2
Baths
1,740
Sq Ft
$147/Sq Ft
Est. Value
About This Home
This home is located at 15335 Dobson Ave, South Holland, IL 60473 and is currently estimated at $256,298, approximately $147 per square foot. 15335 Dobson Ave is a home located in Cook County with nearby schools including Diekman Elementary School, Creative Communications Academy, and School Of Fine Arts Academy.
Ownership History
Date
Name
Owned For
Owner Type
Purchase Details
Closed on
Dec 4, 2003
Sold by
Curtis Anthony C
Bought by
Curtis Anthony C
Current Estimated Value
Home Financials for this Owner
Home Financials are based on the most recent Mortgage that was taken out on this home.
Original Mortgage
$130,000
Outstanding Balance
$60,240
Interest Rate
5.88%
Mortgage Type
New Conventional
Estimated Equity
$196,058
Purchase Details
Closed on
Dec 10, 2002
Sold by
Standard Bank & Trust Co
Bought by
Curtis Anthony C and Anthony C Curtis Trust #1
Purchase Details
Closed on
Jul 20, 2001
Sold by
Standard Bank & Trust Company Hickory
Bought by
Curtis Arthur G and Curtis Venira
Home Financials for this Owner
Home Financials are based on the most recent Mortgage that was taken out on this home.
Original Mortgage
$120,400
Interest Rate
7.15%
Create a Home Valuation Report for This Property
The Home Valuation Report is an in-depth analysis detailing your home's value as well as a comparison with similar homes in the area
Home Values in the Area
Average Home Value in this Area
Purchase History
| Date | Buyer | Sale Price | Title Company |
|---|---|---|---|
| Curtis Anthony C | -- | Ticor | |
| Curtis Anthony C | -- | -- | |
| Curtis Arthur G | -- | Lawyers Title Insurance Corp |
Source: Public Records
Mortgage History
| Date | Status | Borrower | Loan Amount |
|---|---|---|---|
| Open | Curtis Anthony C | $130,000 | |
| Previous Owner | Curtis Arthur G | $120,400 |
Source: Public Records
Tax History Compared to Growth
Tax History
| Year | Tax Paid | Tax Assessment Tax Assessment Total Assessment is a certain percentage of the fair market value that is determined by local assessors to be the total taxable value of land and additions on the property. | Land | Improvement |
|---|---|---|---|---|
| 2024 | $6,602 | $19,000 | $2,931 | $16,069 |
| 2023 | $2,905 | $19,000 | $2,931 | $16,069 |
| 2022 | $2,905 | $11,318 | $2,586 | $8,732 |
| 2021 | $2,824 | $11,318 | $2,586 | $8,732 |
| 2020 | $4,644 | $11,318 | $2,586 | $8,732 |
| 2019 | $3,681 | $9,491 | $2,413 | $7,078 |
| 2018 | $3,637 | $9,491 | $2,413 | $7,078 |
| 2017 | $3,572 | $9,491 | $2,413 | $7,078 |
| 2016 | $5,319 | $11,952 | $2,241 | $9,711 |
| 2015 | $5,049 | $11,952 | $2,241 | $9,711 |
| 2014 | $3,997 | $11,952 | $2,241 | $9,711 |
| 2013 | $5,106 | $12,949 | $2,241 | $10,708 |
Source: Public Records
Map
Nearby Homes
- 15354 Dobson Ave
- 15413 Dobson Ave
- 15401 Ellis Ave
- 15427 Minerva Ave
- 1020 E 153rd St
- 1204 E 154th St
- 15415 Woodlawn Ave E
- 15317 Drexel Ave
- 1208 E 154th St
- 15240 Woodlawn Ave
- 15307 Hastings Dr
- 15530 University Ave
- 1134 E 152nd St
- 15234 Meadow Ln
- 15215 Hastings Dr
- 15230 Meadow Ln
- 1225 King Ave
- 15501 Maryland Ave
- 15134 Hastings Dr
- 1315 Prince Dr
- 15341 Dobson Ave
- 15329 Dobson Ave
- 15347 Dobson Ave
- 15323 Dobson Ave
- 15336 Dobson Ave
- 15330 Dobson Ave
- 15342 Dobson Ave
- 15353 Dobson Ave
- 15324 Dobson Ave
- 15318 Dobson Ave
- 15359 Dobson Ave
- 15311 Dobson Ave
- 15335 Ellis Ave
- 15341 Ellis Ave
- 15329 Ellis Ave
- 15312 Dobson Ave
- 15360 Dobson Ave
- 15321 Ellis Ave
- 15347 Ellis Ave