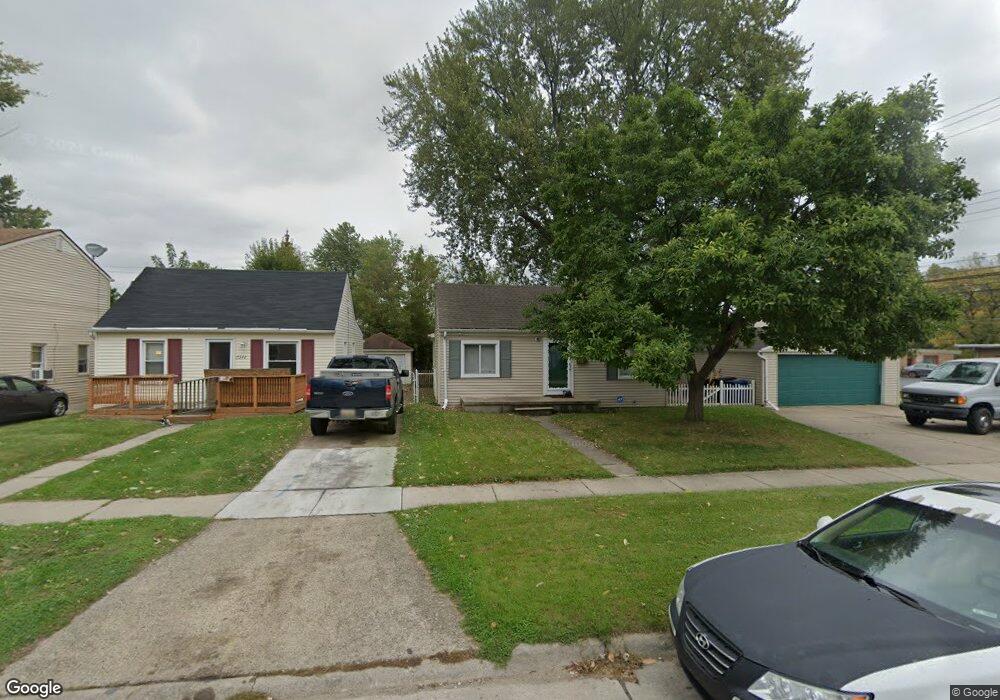
15338 Dixie Unit Bldg-Unit Redford, MI 48239
Estimated Value: $143,000 - $177,000
--
Bed
1
Bath
1,134
Sq Ft
$141/Sq Ft
Est. Value
About This Home
This home is located at 15338 Dixie Unit Bldg-Unit, Redford, MI 48239 and is currently estimated at $160,123, approximately $141 per square foot. 15338 Dixie Unit Bldg-Unit is a home located in Wayne County with nearby schools including Beech Elementary School, Hilbert Middle School, and Redford Union High School.
Ownership History
Date
Name
Owned For
Owner Type
Purchase Details
Closed on
Dec 15, 2021
Sold by
Denti Lauren and Denti Derek
Bought by
Austin Dawnyanique Terese Jasmine
Current Estimated Value
Home Financials for this Owner
Home Financials are based on the most recent Mortgage that was taken out on this home.
Original Mortgage
$127,645
Outstanding Balance
$117,400
Interest Rate
3.11%
Mortgage Type
FHA
Estimated Equity
$42,723
Purchase Details
Closed on
Jun 4, 2018
Sold by
Laesser Norma J
Bought by
Denti Derek
Create a Home Valuation Report for This Property
The Home Valuation Report is an in-depth analysis detailing your home's value as well as a comparison with similar homes in the area
Home Values in the Area
Average Home Value in this Area
Purchase History
| Date | Buyer | Sale Price | Title Company |
|---|---|---|---|
| Austin Dawnyanique Terese Jasmine | $130,000 | Title Solutions Agency Llc | |
| Denti Derek | $76,000 | Estates Title Agency |
Source: Public Records
Mortgage History
| Date | Status | Borrower | Loan Amount |
|---|---|---|---|
| Open | Austin Dawnyanique Terese Jasmine | $127,645 |
Source: Public Records
Tax History Compared to Growth
Tax History
| Year | Tax Paid | Tax Assessment Tax Assessment Total Assessment is a certain percentage of the fair market value that is determined by local assessors to be the total taxable value of land and additions on the property. | Land | Improvement |
|---|---|---|---|---|
| 2025 | $1,207 | $68,700 | $0 | $0 |
| 2024 | $1,207 | $61,000 | $0 | $0 |
| 2023 | $1,151 | $51,900 | $0 | $0 |
| 2022 | $2,776 | $42,100 | $0 | $0 |
| 2021 | $2,124 | $40,400 | $0 | $0 |
| 2020 | $2,095 | $35,100 | $0 | $0 |
| 2019 | $2,050 | $30,400 | $0 | $0 |
| 2018 | $604 | $24,500 | $0 | $0 |
| 2017 | $1,559 | $23,000 | $0 | $0 |
| 2016 | $1,371 | $23,800 | $0 | $0 |
| 2015 | $2,170 | $21,700 | $0 | $0 |
| 2013 | $2,130 | $22,200 | $0 | $0 |
| 2012 | $1,359 | $23,700 | $4,900 | $18,800 |
Source: Public Records
Map
Nearby Homes