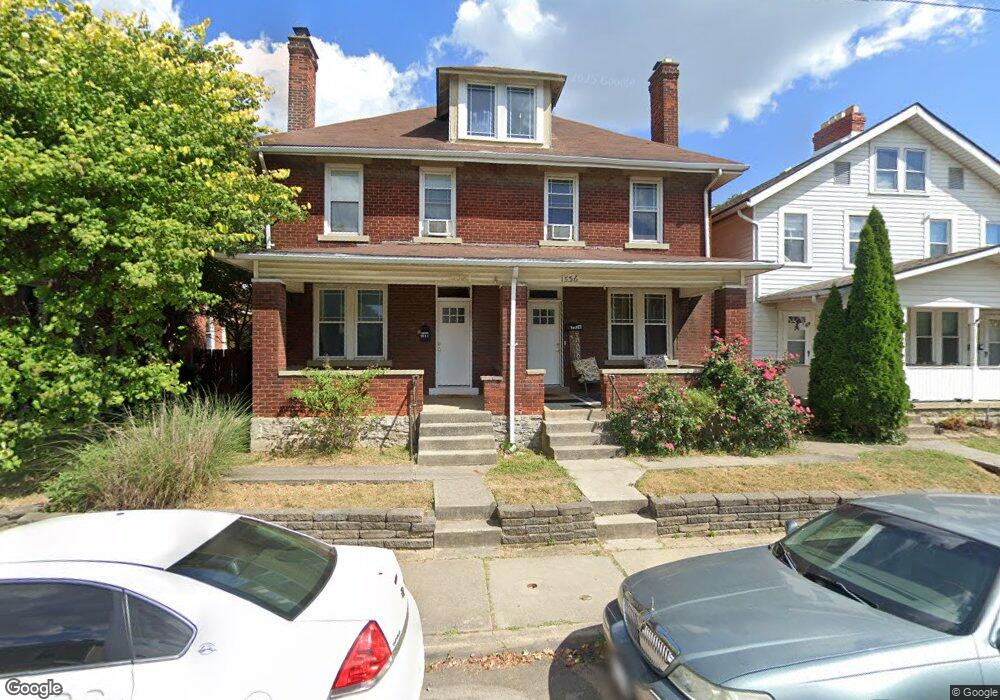
1534 S 4th St Unit 536 Columbus, OH 43207
Merion Village NeighborhoodEstimated Value: $412,000 - $587,147
6
Beds
2
Baths
2,900
Sq Ft
$172/Sq Ft
Est. Value
About This Home
This home is located at 1534 S 4th St Unit 536, Columbus, OH 43207 and is currently estimated at $499,716, approximately $172 per square foot. 1534 S 4th St Unit 536 is a home located in Franklin County with nearby schools including Southwood Elementary School, South High School, and South Columbus Preparatory Academy.
Ownership History
Date
Name
Owned For
Owner Type
Purchase Details
Closed on
Jun 12, 2017
Sold by
Boldt Michael T
Bought by
Boldt Michael T and Michael T Boldt Trust
Current Estimated Value
Home Financials for this Owner
Home Financials are based on the most recent Mortgage that was taken out on this home.
Original Mortgage
$320,000
Interest Rate
3.94%
Mortgage Type
Purchase Money Mortgage
Purchase Details
Closed on
Aug 5, 2003
Sold by
Gartin Alberta J
Bought by
Boldt Michael and Jepsen Marc
Home Financials for this Owner
Home Financials are based on the most recent Mortgage that was taken out on this home.
Original Mortgage
$57,000
Interest Rate
5.31%
Mortgage Type
Seller Take Back
Purchase Details
Closed on
May 17, 1996
Sold by
Marcum Everett
Bought by
Gartin Joe P and Gartin Alberta J
Purchase Details
Closed on
Oct 1, 1978
Create a Home Valuation Report for This Property
The Home Valuation Report is an in-depth analysis detailing your home's value as well as a comparison with similar homes in the area
Home Values in the Area
Average Home Value in this Area
Purchase History
| Date | Buyer | Sale Price | Title Company |
|---|---|---|---|
| Boldt Michael T | -- | None Available | |
| Boldt Michael | $82,000 | -- | |
| Gartin Joe P | $40,000 | -- | |
| -- | $29,000 | -- |
Source: Public Records
Mortgage History
| Date | Status | Borrower | Loan Amount |
|---|---|---|---|
| Previous Owner | Boldt Michael T | $320,000 | |
| Previous Owner | Boldt Michael | $57,000 |
Source: Public Records
Tax History Compared to Growth
Tax History
| Year | Tax Paid | Tax Assessment Tax Assessment Total Assessment is a certain percentage of the fair market value that is determined by local assessors to be the total taxable value of land and additions on the property. | Land | Improvement |
|---|---|---|---|---|
| 2024 | $11,667 | $168,390 | $46,410 | $121,980 |
| 2023 | $7,621 | $168,385 | $46,410 | $121,975 |
| 2022 | $3,901 | $73,400 | $13,230 | $60,170 |
| 2021 | $4,125 | $73,400 | $13,230 | $60,170 |
| 2020 | $4,013 | $73,400 | $13,230 | $60,170 |
| 2019 | $3,382 | $54,390 | $9,800 | $44,590 |
| 2018 | $3,082 | $54,390 | $9,800 | $44,590 |
| 2017 | $3,139 | $54,390 | $9,800 | $44,590 |
| 2016 | $2,896 | $42,630 | $6,860 | $35,770 |
| 2015 | $2,637 | $42,630 | $6,860 | $35,770 |
| 2014 | $2,643 | $42,630 | $6,860 | $35,770 |
| 2013 | $1,448 | $47,355 | $7,630 | $39,725 |
Source: Public Records
Map
Nearby Homes
- 1542 S 4th St Unit 1542
- 1534 S 4th St Unit 1536
- 1543 S 4th St Unit 1543
- 73-75 E Markison Ave
- 1583 S 4th St
- 158 E Morrill Ave
- 1563 S 6th St
- 1452 S 4th St
- 220 E Welch Ave
- 129 E Hinman Ave
- 1420 S 4th St
- 27 W Welch Ave
- 1437 S High St Unit 439
- 1613 S 8th St
- 43 W Markison Ave
- 1366 S 4th St
- 1374 S 5th St
- 1357 City Park Ave Unit 359
- 92 E Innis Ave
- 323 Southwood Ave
- 1538 S 4th St Unit 540
- 1528 S 4th St
- 1540 S 4th St
- 1524 S 4th St
- 1544 S 4th St Unit 1544
- 1524 S 4th St Unit TWENTY
- 1548 S 4th St Unit 1548
- 1550 S 4th St Unit 1550
- 127 E Markison Ave
- 133 E Markison Ave
- 133 E Markison Ave Unit A-C
- 1539 S 4th St Unit 1539
- 1541 S 4th St Unit 1541
- 1554 S 4th St
- 1545 S 4th St Unit 1545
- 124 E Welch Ave
- 1547 S 4th St Unit 1547
- 1558 S 4th St
- 1535 S 4th St
- 1533 S 4th St