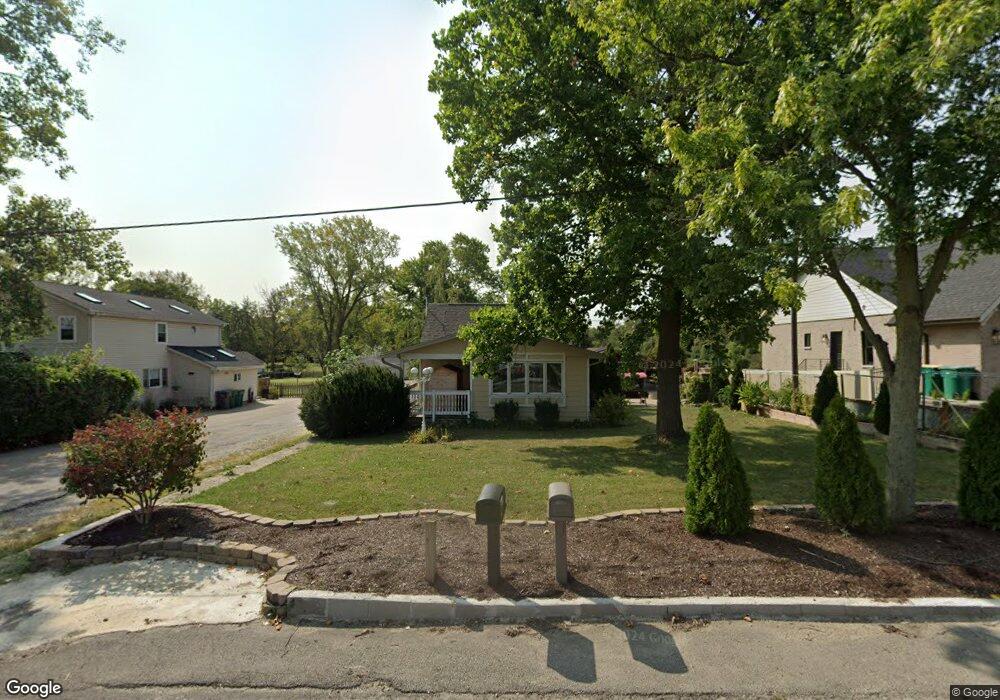
15340 129th St Lemont, IL 60439
Southeast Lemont NeighborhoodEstimated Value: $333,000 - $446,000
3
Beds
1
Bath
1,559
Sq Ft
$256/Sq Ft
Est. Value
About This Home
This home is located at 15340 129th St, Lemont, IL 60439 and is currently estimated at $399,203, approximately $256 per square foot. 15340 129th St is a home located in Cook County with nearby schools including Oakwood School, River Valley School, and Old Quarry Middle School.
Ownership History
Date
Name
Owned For
Owner Type
Purchase Details
Closed on
Oct 10, 2008
Sold by
Pilelis Gediminas and Miliute Ausra
Bought by
Zentikas Arunas and Kavickaite Rimante
Current Estimated Value
Home Financials for this Owner
Home Financials are based on the most recent Mortgage that was taken out on this home.
Original Mortgage
$164,250
Outstanding Balance
$106,620
Interest Rate
5.94%
Mortgage Type
Purchase Money Mortgage
Estimated Equity
$292,583
Purchase Details
Closed on
Oct 8, 2004
Sold by
Landgren Vickie D
Bought by
Pilelis Gediminas and Miliute Ausra
Home Financials for this Owner
Home Financials are based on the most recent Mortgage that was taken out on this home.
Original Mortgage
$172,000
Interest Rate
7.55%
Mortgage Type
Unknown
Purchase Details
Closed on
Jan 14, 2004
Sold by
Billings Frances
Bought by
Landgren Vickie D
Create a Home Valuation Report for This Property
The Home Valuation Report is an in-depth analysis detailing your home's value as well as a comparison with similar homes in the area
Home Values in the Area
Average Home Value in this Area
Purchase History
| Date | Buyer | Sale Price | Title Company |
|---|---|---|---|
| Zentikas Arunas | $182,500 | None Available | |
| Pilelis Gediminas | $215,000 | Ctic | |
| Landgren Vickie D | -- | -- |
Source: Public Records
Mortgage History
| Date | Status | Borrower | Loan Amount |
|---|---|---|---|
| Open | Zentikas Arunas | $164,250 | |
| Previous Owner | Pilelis Gediminas | $172,000 | |
| Closed | Pilelis Gediminas | $43,000 |
Source: Public Records
Tax History Compared to Growth
Tax History
| Year | Tax Paid | Tax Assessment Tax Assessment Total Assessment is a certain percentage of the fair market value that is determined by local assessors to be the total taxable value of land and additions on the property. | Land | Improvement |
|---|---|---|---|---|
| 2024 | $8,049 | $44,839 | $14,185 | $30,654 |
| 2023 | $5,176 | $44,839 | $14,185 | $30,654 |
| 2022 | $5,176 | $26,398 | $12,548 | $13,850 |
| 2021 | $5,373 | $27,885 | $12,548 | $15,337 |
| 2020 | $5,501 | $27,885 | $12,548 | $15,337 |
| 2019 | $4,423 | $23,940 | $12,548 | $11,392 |
| 2018 | $4,353 | $23,940 | $12,548 | $11,392 |
| 2017 | $4,308 | $23,940 | $12,548 | $11,392 |
| 2016 | $3,846 | $19,984 | $10,365 | $9,619 |
| 2015 | $3,885 | $19,984 | $10,365 | $9,619 |
| 2014 | $3,943 | $19,984 | $10,365 | $9,619 |
| 2013 | $4,208 | $22,404 | $10,365 | $12,039 |
Source: Public Records
Map
Nearby Homes
- 1408 Ashbury Dr
- 1341 Ashbury Cir
- 1236 Prairie Ln Unit 5-B
- 1232 Prairie Ln Unit 5-A
- 1228 Prairie Ln Unit 4B
- 1228 Prairie Ln
- 1224 Prairie Ln
- 1213 Prairie Ln
- 15500 E 127th St
- 16500 Kayla Dr
- 180 Grove Ct
- 173 Harper Ln
- 5 Melissa Dr
- 1365 State St
- 12920 Marble St
- 12830 Marble St Unit 25A
- 1409 Notting Hill Dr
- 12853 Marble St Unit 27A
- 15082 131st St
- 1382 Overton Dr
- 15330 129th St
- 15368 129th St
- 15328 129th St
- 15344 129th St
- 15354 129th St
- 1408 Notting Hill Dr
- 15326 129th St
- 1412 Notting Hill Dr
- 1406 Notting Hill Dr
- 1414 Notting Hill Dr
- 1410 Notting Hill Dr
- 1416 Notting Hill Dr
- 1429 Notting Hill Dr
- 1427 Notting Hill Dr
- 15411 129th St
- 346 Ashbury Place
- 15300 129th St
- 1407 Notting Hill Dr
- 342 Ashbury Place
- 1413 Notting Hill Dr