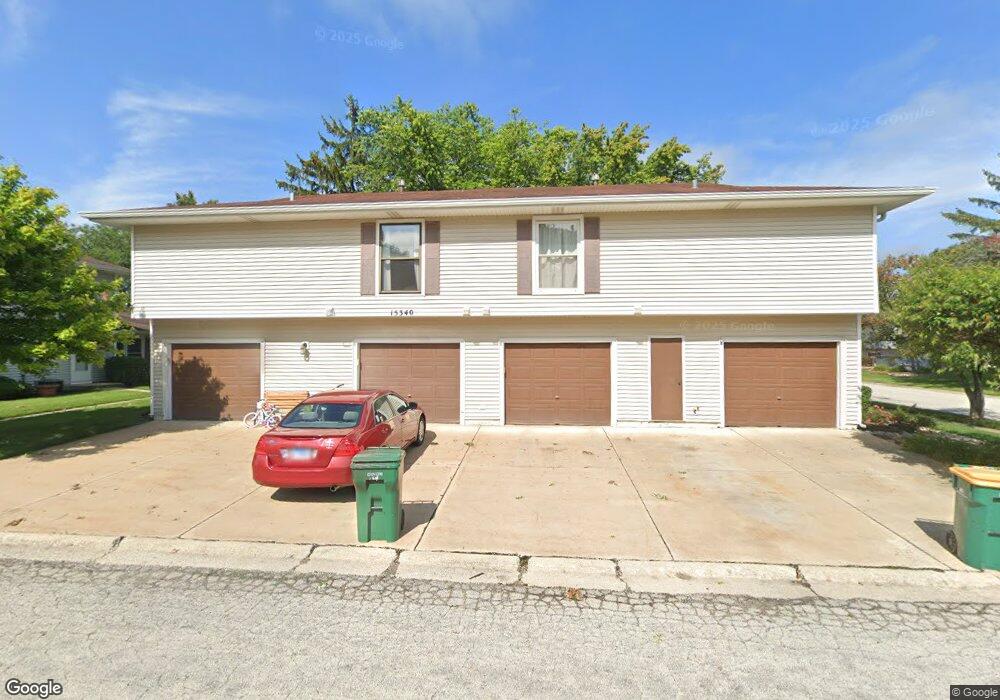
15340 Holly Ct Unit 7C Oak Forest, IL 60452
Estimated Value: $181,000 - $228,000
2
Beds
1
Bath
1,500
Sq Ft
$132/Sq Ft
Est. Value
About This Home
This home is located at 15340 Holly Ct Unit 7C, Oak Forest, IL 60452 and is currently estimated at $197,716, approximately $131 per square foot. 15340 Holly Ct Unit 7C is a home located in Cook County with nearby schools including Kerkstra Elementary School, Jack Hille Middle School, and Oak Forest High School.
Ownership History
Date
Name
Owned For
Owner Type
Purchase Details
Closed on
Apr 22, 2004
Sold by
Messina Susan M and Cash Susan M
Bought by
Cash Paul E and Cash Susan M
Current Estimated Value
Home Financials for this Owner
Home Financials are based on the most recent Mortgage that was taken out on this home.
Original Mortgage
$107,950
Outstanding Balance
$50,694
Interest Rate
5.63%
Mortgage Type
New Conventional
Estimated Equity
$147,022
Purchase Details
Closed on
Jan 15, 1999
Sold by
Morrow Kenneth and Morrow Rebecca L
Bought by
Messina Susan M
Home Financials for this Owner
Home Financials are based on the most recent Mortgage that was taken out on this home.
Original Mortgage
$86,400
Interest Rate
6.76%
Purchase Details
Closed on
Nov 17, 1995
Sold by
Cain Thomas E
Bought by
Morrow Kenneth K and Brickson Rebecca L
Home Financials for this Owner
Home Financials are based on the most recent Mortgage that was taken out on this home.
Original Mortgage
$76,500
Interest Rate
7.2%
Create a Home Valuation Report for This Property
The Home Valuation Report is an in-depth analysis detailing your home's value as well as a comparison with similar homes in the area
Home Values in the Area
Average Home Value in this Area
Purchase History
| Date | Buyer | Sale Price | Title Company |
|---|---|---|---|
| Cash Paul E | -- | Law Title | |
| Messina Susan M | $96,000 | -- | |
| Morrow Kenneth K | $85,000 | Attorneys Natl Title Network |
Source: Public Records
Mortgage History
| Date | Status | Borrower | Loan Amount |
|---|---|---|---|
| Open | Cash Paul E | $107,950 | |
| Closed | Messina Susan M | $86,400 | |
| Previous Owner | Morrow Kenneth K | $76,500 |
Source: Public Records
Tax History Compared to Growth
Tax History
| Year | Tax Paid | Tax Assessment Tax Assessment Total Assessment is a certain percentage of the fair market value that is determined by local assessors to be the total taxable value of land and additions on the property. | Land | Improvement |
|---|---|---|---|---|
| 2024 | $2,868 | $15,136 | $1,931 | $13,205 |
| 2023 | $2,257 | $15,136 | $1,931 | $13,205 |
| 2022 | $2,257 | $11,533 | $1,716 | $9,817 |
| 2021 | $1,055 | $11,532 | $1,716 | $9,816 |
| 2020 | $3,319 | $11,532 | $1,716 | $9,816 |
| 2019 | $2,174 | $8,827 | $1,609 | $7,218 |
| 2018 | $2,135 | $8,827 | $1,609 | $7,218 |
| 2017 | $2,166 | $8,827 | $1,609 | $7,218 |
| 2016 | $2,471 | $8,512 | $1,394 | $7,118 |
| 2015 | $2,500 | $8,856 | $1,394 | $7,462 |
| 2014 | $2,888 | $9,986 | $1,394 | $8,592 |
| 2013 | $2,802 | $10,656 | $1,394 | $9,262 |
Source: Public Records
Map
Nearby Homes
- 5237 Diamond Dr Unit B
- 5218 Laramie Ct
- 5341 Crescent Ln Unit D
- 16207 Long Ave
- 15210 Laramie Ave
- 5117 154th St
- 5313 Crescent Green Ln
- 5556 Natalie Dr
- 15601 Latrobe Ave
- 5008 155th St
- 5028 156th St
- 15641 Laramie Ave
- 17301 Lockwood Ave
- 15240 Laporte Ave
- 5653 Dover Rd
- 5310 159th St
- 15804 Laramie Ave Unit 4
- 16352 169 Lot #15 Place
- 16352 169 Lot #13 Place
- 16352 169 Lot #14 Place
- 15340 Holly Ct Unit 7D
- 15340 Holly Ct Unit 7B
- 15340 Holly Ct Unit 7A
- 15340 Holly Ct Unit D
- 15340 Holly Ct Unit A
- 15340 Holly Ct Unit B
- 5248 Woodland Dr Unit E1
- 5235 Laramie Ct
- 15330 Holly Ct Unit C
- 15330 Holly Ct Unit 15B
- 15330 Holly Ct Unit 15D
- 15330 Holly Ct Unit 15C
- 15330 Holly Ct Unit 15A
- 15330 Holly Ct Unit B
- 15341 Meadow Ct
- 15343 Meadow Ct Unit B2
- 5300 Woodland Dr Unit 17D
- 5300 Woodland Dr Unit 17B
- 5300 Woodland Dr Unit 17A