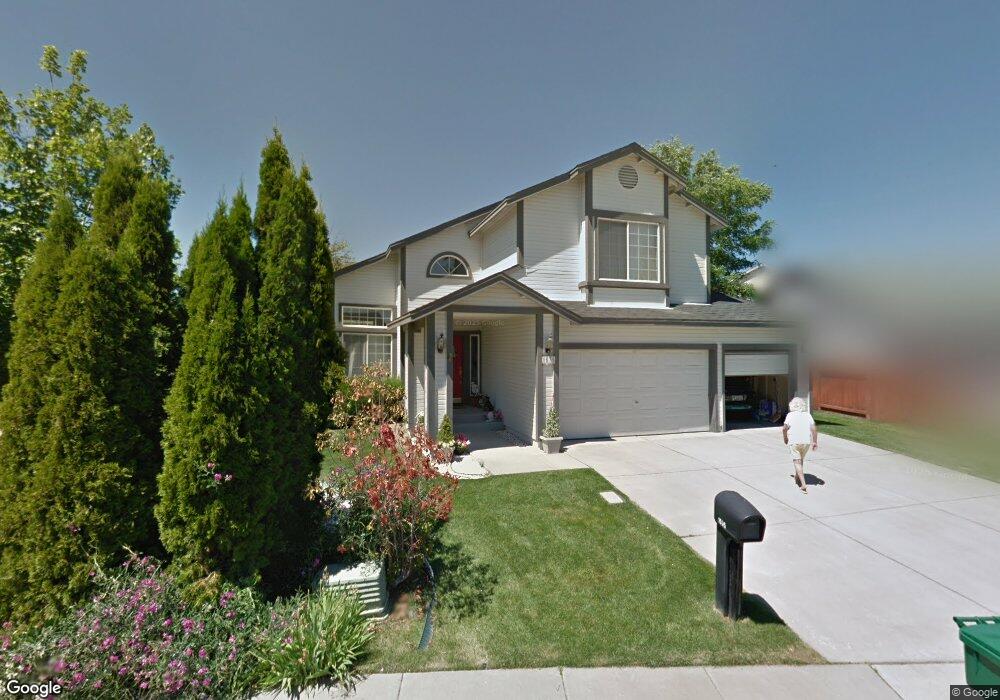
1535 Backer Way Reno, NV 89523
Mae Anne Avenue NeighborhoodEstimated Value: $637,000 - $641,963
4
Beds
4
Baths
2,130
Sq Ft
$300/Sq Ft
Est. Value
About This Home
This home is located at 1535 Backer Way, Reno, NV 89523 and is currently estimated at $639,654, approximately $300 per square foot. 1535 Backer Way is a home located in Washoe County with nearby schools including Sarah Winnemucca Elementary School, B D Billinghurst Middle School, and Robert McQueen High School.
Ownership History
Date
Name
Owned For
Owner Type
Purchase Details
Closed on
Aug 8, 2024
Sold by
Santana Troy and Santana Valerie
Bought by
Santana Pure Life Trust and Santana
Current Estimated Value
Purchase Details
Closed on
Dec 13, 2019
Sold by
Santana Valerie and Hand Valerie
Bought by
Santana Troy and Santana Valerie
Purchase Details
Closed on
Jun 21, 2018
Sold by
Little City Homes Inc
Bought by
Hand Valerie
Home Financials for this Owner
Home Financials are based on the most recent Mortgage that was taken out on this home.
Original Mortgage
$370,500
Interest Rate
4.5%
Mortgage Type
New Conventional
Purchase Details
Closed on
Jun 19, 2018
Sold by
Little City Homes Inc
Bought by
Hand Valerie
Home Financials for this Owner
Home Financials are based on the most recent Mortgage that was taken out on this home.
Original Mortgage
$370,500
Interest Rate
4.5%
Mortgage Type
New Conventional
Purchase Details
Closed on
May 10, 2018
Sold by
Barber Janon and Davimes Linda
Bought by
Little City Homes Inc
Home Financials for this Owner
Home Financials are based on the most recent Mortgage that was taken out on this home.
Original Mortgage
$370,500
Interest Rate
4.5%
Mortgage Type
New Conventional
Purchase Details
Closed on
Dec 12, 2008
Sold by
Johnson Betty J and Johnson Non P
Bought by
Johnson Betty J and Johnson Non P
Home Financials for this Owner
Home Financials are based on the most recent Mortgage that was taken out on this home.
Original Mortgage
$480,000
Interest Rate
2.94%
Mortgage Type
Reverse Mortgage Home Equity Conversion Mortgage
Purchase Details
Closed on
Jun 21, 1999
Sold by
Davimes Linda
Bought by
Johnson Non P and Johnson Betty J
Home Financials for this Owner
Home Financials are based on the most recent Mortgage that was taken out on this home.
Original Mortgage
$104,000
Interest Rate
7.05%
Purchase Details
Closed on
Oct 13, 1998
Sold by
Johnson Non P and Johnson Betty J
Bought by
Johnson Non P and Johnson Betty J
Purchase Details
Closed on
Aug 4, 1995
Sold by
Simons Moore Frank Ltd Liability Company
Bought by
Johnson Non P and Johnson Betty J
Home Financials for this Owner
Home Financials are based on the most recent Mortgage that was taken out on this home.
Original Mortgage
$85,000
Interest Rate
7.61%
Create a Home Valuation Report for This Property
The Home Valuation Report is an in-depth analysis detailing your home's value as well as a comparison with similar homes in the area
Home Values in the Area
Average Home Value in this Area
Purchase History
| Date | Buyer | Sale Price | Title Company |
|---|---|---|---|
| Santana Pure Life Trust | -- | None Listed On Document | |
| Santana Troy | -- | None Available | |
| Hand Valerie | $390,000 | Western Title Co Llc | |
| Hand Valerie | $390,000 | Western Title Co | |
| Little City Homes Inc | $330,500 | Western Title Co | |
| Johnson Betty J | -- | First Centennial Reno | |
| Johnson Non P | -- | First American Title Co | |
| Johnson Non P | -- | -- | |
| Johnson Non P | -- | First American Title Co |
Source: Public Records
Mortgage History
| Date | Status | Borrower | Loan Amount |
|---|---|---|---|
| Previous Owner | Hand Valerie | $370,500 | |
| Previous Owner | Johnson Betty J | $480,000 | |
| Previous Owner | Johnson Non P | $104,000 | |
| Previous Owner | Johnson Non P | $85,000 |
Source: Public Records
Tax History Compared to Growth
Tax History
| Year | Tax Paid | Tax Assessment Tax Assessment Total Assessment is a certain percentage of the fair market value that is determined by local assessors to be the total taxable value of land and additions on the property. | Land | Improvement |
|---|---|---|---|---|
| 2025 | $3,133 | $115,699 | $44,240 | $71,459 |
| 2024 | $3,133 | $113,796 | $41,300 | $72,496 |
| 2023 | $3,043 | $112,764 | $43,855 | $68,909 |
| 2022 | $2,955 | $93,649 | $36,120 | $57,529 |
| 2021 | $2,869 | $82,160 | $24,675 | $57,485 |
| 2020 | $2,783 | $83,609 | $25,795 | $57,814 |
| 2019 | $2,701 | $79,592 | $23,590 | $56,002 |
| 2018 | $2,577 | $71,952 | $17,220 | $54,732 |
| 2017 | $2,511 | $71,384 | $16,065 | $55,319 |
| 2016 | $2,447 | $72,128 | $15,680 | $56,448 |
| 2015 | $1,227 | $70,166 | $13,685 | $56,481 |
| 2014 | $2,381 | $65,380 | $11,060 | $54,320 |
| 2013 | -- | $62,633 | $9,065 | $53,568 |
Source: Public Records
Map
Nearby Homes
- 1500 Backer Way
- 5830 Blue Horizon Dr
- 5870 Blue Horizon Dr
- 5895 Blue Horizon Dr
- 1659 Shadow Park Dr
- 5882 Grand Row Way Unit Lot 61
- 5878 Grand Row Way
- 1689 Shadow Park Dr
- 1627 Prancer St Unit Lot 50
- 1627 Prancer St
- 1615 Prancer St Unit Lot 53
- Walker Plan at Monarch
- Humboldt Plan at Monarch
- 1618 Icelandic Way Unit Lot 67
- 1618 Icelandic Way
- 1626 Icelandic Way
- 1639 Prancer St Unit Lot 47
- 5849 Morgan Horse St
- 1708 Kristin Way
- 0 Simons Dr
- 1545 Backer Way
- 5825 Blue Horizon Dr
- 1555 Backer Way
- 1544 Corona Ct
- 5820 Blue Horizon Dr
- 1538 Backer Way Unit 2B
- 1528 Backer Way
- 1548 Backer Way
- 1518 Backer Way
- 1545 Corona Ct
- 1558 Backer Way
- 5840 Blue Horizon Dr
- 1508 Backer Way
- 5865 Blue Horizon Dr
- 5850 Blue Horizon Dr
- 5825 Simons Dr
- 5835 Simons Dr
- 1599 Shadow Park Dr
- 1560 Grand Point Way
- 1550 Grand Point Way