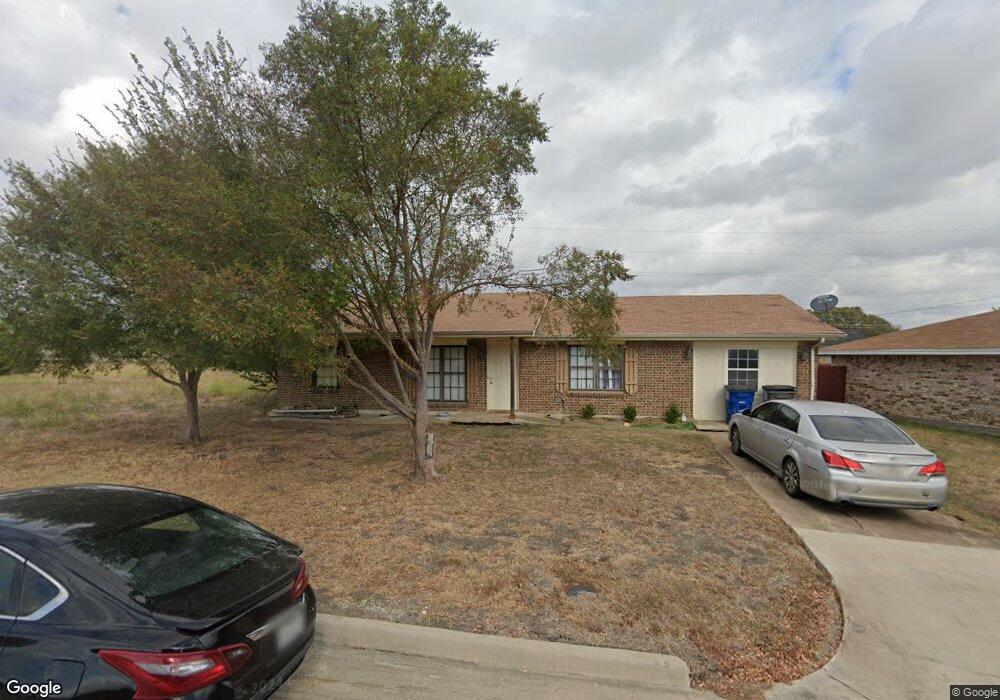
1535 El Camino Cir Princeton, TX 75407
Estimated Value: $228,000 - $304,000
4
Beds
2
Baths
1,342
Sq Ft
$196/Sq Ft
Est. Value
About This Home
This home is located at 1535 El Camino Cir, Princeton, TX 75407 and is currently estimated at $262,911, approximately $195 per square foot. 1535 El Camino Cir is a home located in Collin County with nearby schools including Godwin Elementary School, Clark Middle School, and Princeton High School.
Ownership History
Date
Name
Owned For
Owner Type
Purchase Details
Closed on
Nov 3, 2017
Sold by
Barker Cynthia Lynn and Barker Douglas Michael
Bought by
Wright Samuel L
Current Estimated Value
Home Financials for this Owner
Home Financials are based on the most recent Mortgage that was taken out on this home.
Original Mortgage
$152,367
Outstanding Balance
$127,609
Interest Rate
3.83%
Mortgage Type
VA
Estimated Equity
$135,302
Purchase Details
Closed on
Sep 17, 2003
Sold by
Douglas Cynthia L and Douglas Michael J
Bought by
Douglas Michael J and Douglas Cynthia L
Home Financials for this Owner
Home Financials are based on the most recent Mortgage that was taken out on this home.
Original Mortgage
$45,938
Interest Rate
5.74%
Mortgage Type
FHA
Purchase Details
Closed on
May 30, 1995
Sold by
Brown Randy Joe
Bought by
Brown Cynthia Lynn
Home Financials for this Owner
Home Financials are based on the most recent Mortgage that was taken out on this home.
Original Mortgage
$49,433
Interest Rate
8.34%
Create a Home Valuation Report for This Property
The Home Valuation Report is an in-depth analysis detailing your home's value as well as a comparison with similar homes in the area
Home Values in the Area
Average Home Value in this Area
Purchase History
| Date | Buyer | Sale Price | Title Company |
|---|---|---|---|
| Wright Samuel L | -- | None Available | |
| Douglas Michael J | -- | Rtt | |
| Brown Cynthia Lynn | -- | -- |
Source: Public Records
Mortgage History
| Date | Status | Borrower | Loan Amount |
|---|---|---|---|
| Open | Wright Samuel L | $152,367 | |
| Previous Owner | Douglas Michael J | $45,938 | |
| Previous Owner | Brown Cynthia Lynn | $49,433 |
Source: Public Records
Tax History Compared to Growth
Tax History
| Year | Tax Paid | Tax Assessment Tax Assessment Total Assessment is a certain percentage of the fair market value that is determined by local assessors to be the total taxable value of land and additions on the property. | Land | Improvement |
|---|---|---|---|---|
| 2025 | $488 | $174,247 | $60,000 | $145,584 |
| 2024 | $488 | $158,406 | $60,000 | $166,240 |
| 2023 | $488 | $144,005 | $60,000 | $154,314 |
| 2022 | $2,895 | $130,914 | $50,000 | $153,493 |
| 2021 | $2,752 | $162,011 | $30,000 | $132,011 |
| 2020 | $2,706 | $162,179 | $30,000 | $132,179 |
| 2019 | $2,529 | $98,358 | $25,000 | $132,226 |
| 2018 | $3,547 | $137,377 | $16,000 | $121,377 |
| 2017 | $2,099 | $95,011 | $16,000 | $79,011 |
| 2016 | $1,921 | $76,819 | $16,000 | $60,819 |
| 2015 | $1,369 | $70,866 | $16,000 | $54,866 |
Source: Public Records
Map
Nearby Homes
- 509 Covington Cove
- R. Nation Plan at Solena
- Wilson Plan at Solena
- Res. K Plan at Solena
- Acorn 48 Plan at Solena
- Gateway Plan at Solena
- 1605 Fox Dr Unit 3
- Lexi Plan at Solena
- Essence Plan at Solena
- 1605 Fox Dr Unit 6
- Res. X Plan at Solena
- Still the One Plan at Solena
- 1605 Fox Dr Unit 7
- Luna Plan at Solena
- 1605 Fox Dr Unit 5
- 1605 Fox Dr Unit 2
- 1407 El Camino Cir
- 619 Delaware Ave
- Willow Plan at Princeton Heights
- Piper Plan at Princeton Heights
- 1531 El Camino Cir
- 505 County Road 461
- 509 E Monte Carlo Blvd
- 509 E Monte Carlo Blvd
- 1514 El Camino Cir
- 1529 El Camino Cir
- 513 County Road 461
- 1510 El Camino Cir
- 1525 El Camino Cir
- 517 E Monte Carlo Blvd
- 1515 El Camino Cir
- 517 County Road 461
- 1511 El Camino Cir
- 403 County Road 461
- 403 E Monte Carlo Blvd
- 1521 N 4th St
- 1500 El Camino Cir
- 513 Cove Ct
- 513 Covington Cove
- 1507 El Camino Cir