Estimated Value: $409,978
--
Bed
2
Baths
24,080
Sq Ft
$17/Sq Ft
Est. Value
About This Home
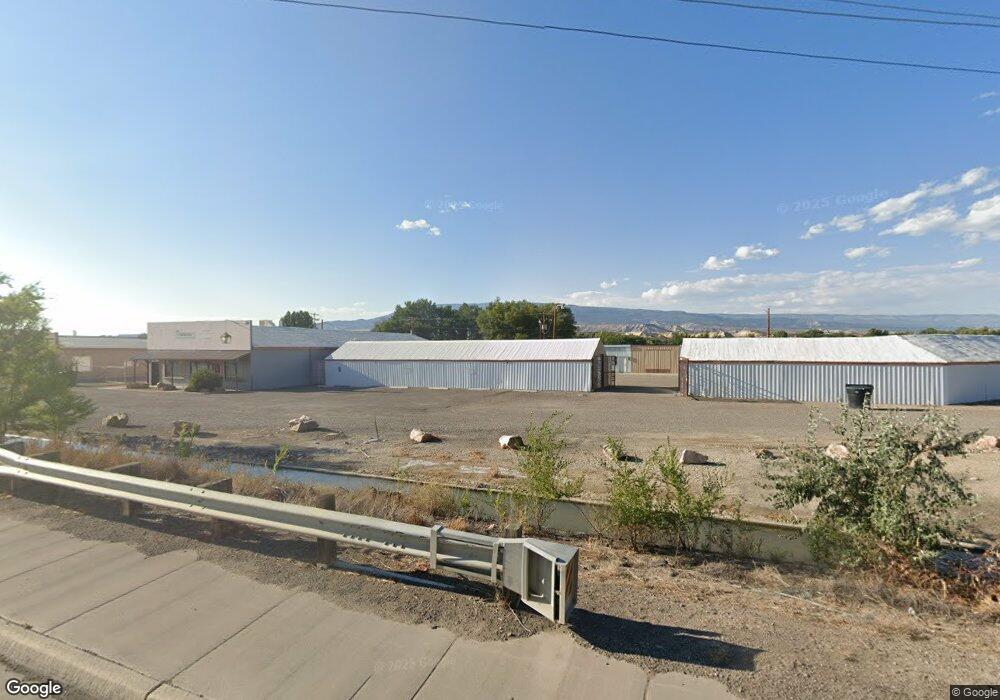
This home is located at 1535 Highway 50, Delta, CO 81416 and is currently estimated at $409,978, approximately $17 per square foot. 1535 Highway 50 is a home located in Delta County with nearby schools including Garnet Mesa Elementary School, Lincoln Elementary School, and Delta Middle School.
Ownership History
Date
Name
Owned For
Owner Type
Purchase Details
Closed on
Dec 15, 2021
Sold by
Clark Kevin R
Bought by
Black Horse Real Estates Llc
Current Estimated Value
Home Financials for this Owner
Home Financials are based on the most recent Mortgage that was taken out on this home.
Original Mortgage
$258,750
Outstanding Balance
$237,918
Interest Rate
3.09%
Mortgage Type
New Conventional
Estimated Equity
$172,060
Purchase Details
Closed on
May 5, 2003
Sold by
Us Small Business Administration
Bought by
Clark Kevin R and Clark Kevin R
Purchase Details
Closed on
Oct 6, 1997
Sold by
Small Business Administration
Bought by
Sharr Clark Kevin R and Sharr Clark
Purchase Details
Closed on
Feb 17, 1993
Sold by
Stoody
Bought by
Garbacz Clark Kevin R and Garbacz Clark
Purchase Details
Closed on
Aug 12, 1987
Sold by
Colo Bank & Trust
Bought by
Clark Kevin R and Stoody John R
Create a Home Valuation Report for This Property
The Home Valuation Report is an in-depth analysis detailing your home's value as well as a comparison with similar homes in the area
Home Values in the Area
Average Home Value in this Area
Purchase History
| Date | Buyer | Sale Price | Title Company |
|---|---|---|---|
| Black Horse Real Estates Llc | $345,000 | None Listed On Document | |
| Clark Kevin R | $185,000 | -- | |
| Sharr Clark Kevin R | $250,000 | -- | |
| Garbacz Clark Kevin R | $100,000 | -- | |
| Clark Kevin R | $72,000 | -- |
Source: Public Records
Mortgage History
| Date | Status | Borrower | Loan Amount |
|---|---|---|---|
| Open | Black Horse Real Estates Llc | $258,750 |
Source: Public Records
Tax History Compared to Growth
Tax History
| Year | Tax Paid | Tax Assessment Tax Assessment Total Assessment is a certain percentage of the fair market value that is determined by local assessors to be the total taxable value of land and additions on the property. | Land | Improvement |
|---|---|---|---|---|
| 2024 | $4,781 | $72,246 | $18,414 | $53,832 |
| 2023 | $4,781 | $72,246 | $18,414 | $53,832 |
| 2022 | $2,464 | $38,177 | $14,500 | $23,677 |
| 2021 | $2,418 | $38,177 | $14,500 | $23,677 |
| 2020 | $2,252 | $35,046 | $11,600 | $23,446 |
| 2019 | $2,229 | $35,046 | $11,600 | $23,446 |
| 2018 | $2,391 | $36,240 | $11,600 | $24,640 |
| 2017 | $2,451 | $38,252 | $11,600 | $26,652 |
| 2016 | $2,547 | $43,521 | $15,950 | $27,571 |
| 2014 | -- | $38,313 | $15,950 | $22,363 |
Source: Public Records
Map
Nearby Homes
- TBD 1500 Ct
- 760 1575 Rd
- 10.5 ac. LOT 1B 1525 Rd
- 1511 Yankee Girl St
- 1491 Highway 50 Unit 64
- 15101 Silver Belle St
- 15143 Silver Belle St
- 15179 Silver Belle St
- 1475 and Tbd Highway 50
- 1570 G86 Ln
- 676 Highway 50 Unit Space 43
- 167 Gunnison River Dr
- 1637 I Rd
- 1639 I Rd
- 311 W 3rd St
- 1397 Highway 50
- 184 Garnet Ave
- 65 Circle Dr
- 337 & 341 Palmer St
- 833 and 835 Garnet Ave
- 1548 Vista St
- Lot 6 Vista St
- 1531 & 153 50 Hwy Unit 1 & 2
- 1531 Highway 50
- 1531 & 1533 50 Hwy Unit 1 & 2
- 50 Highway
- 50 Highway Unit 1 & 2
- 1541 U S 50
- 1541 Highway 50
- 0 Vista Delta Monte Unit 628358
- 0 Vista Delta Monte Unit 628357
- 0 Vista Delta Monte Unit 627434
- 0 Vista Delta Monte Unit 627433
- 1527 U S 50
- 0 Vista St
- Lot 7 Vista St
- 0 Vista Del Monte Unit 654260
- 0 Vista Del Monte Unit 654259
- 0 Vista Del Monte Unit 654258
- 0 Vista Del Monte Unit 654253