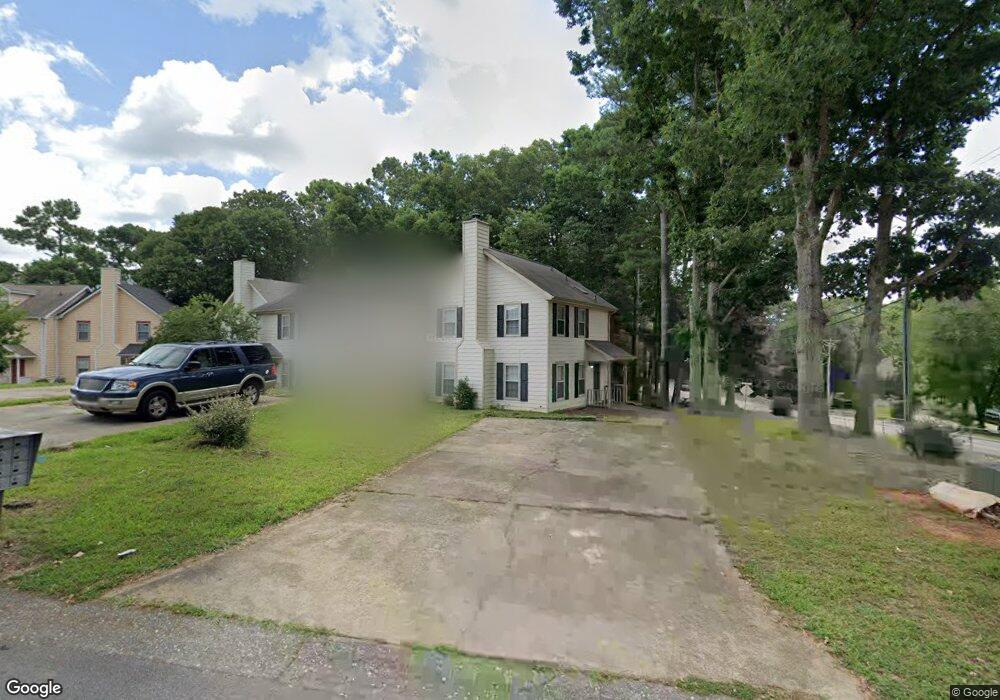
1535 Kennesaw Trace Ct NW Unit 1 Kennesaw, GA 30144
Estimated Value: $216,000 - $272,000
2
Beds
2
Baths
1,120
Sq Ft
$214/Sq Ft
Est. Value
About This Home
This home is located at 1535 Kennesaw Trace Ct NW Unit 1, Kennesaw, GA 30144 and is currently estimated at $239,595, approximately $213 per square foot. 1535 Kennesaw Trace Ct NW Unit 1 is a home located in Cobb County with nearby schools including Kennesaw Elementary School, Big Shanty Elementary School, and Palmer Middle School.
Ownership History
Date
Name
Owned For
Owner Type
Purchase Details
Closed on
Sep 10, 2002
Sold by
Mulligan Elizabeth A
Bought by
Palmer Terry R
Current Estimated Value
Home Financials for this Owner
Home Financials are based on the most recent Mortgage that was taken out on this home.
Original Mortgage
$87,400
Outstanding Balance
$36,586
Interest Rate
6.4%
Mortgage Type
New Conventional
Estimated Equity
$203,009
Purchase Details
Closed on
Mar 31, 1994
Sold by
Administration Of Va
Bought by
Mulligan Elizabeth A
Home Financials for this Owner
Home Financials are based on the most recent Mortgage that was taken out on this home.
Original Mortgage
$62,225
Interest Rate
6.75%
Mortgage Type
VA
Purchase Details
Closed on
Jul 6, 1993
Sold by
Aungst Jn M
Bought by
Banc Boston Mtg
Create a Home Valuation Report for This Property
The Home Valuation Report is an in-depth analysis detailing your home's value as well as a comparison with similar homes in the area
Home Values in the Area
Average Home Value in this Area
Purchase History
| Date | Buyer | Sale Price | Title Company |
|---|---|---|---|
| Palmer Terry R | $92,000 | -- | |
| Mulligan Elizabeth A | $65,500 | -- | |
| Banc Boston Mtg | $44,700 | -- |
Source: Public Records
Mortgage History
| Date | Status | Borrower | Loan Amount |
|---|---|---|---|
| Open | Palmer Terry R | $87,400 | |
| Previous Owner | Mulligan Elizabeth A | $62,225 |
Source: Public Records
Tax History Compared to Growth
Tax History
| Year | Tax Paid | Tax Assessment Tax Assessment Total Assessment is a certain percentage of the fair market value that is determined by local assessors to be the total taxable value of land and additions on the property. | Land | Improvement |
|---|---|---|---|---|
| 2025 | $2,459 | $81,620 | $18,000 | $63,620 |
| 2024 | $2,461 | $81,620 | $18,000 | $63,620 |
| 2023 | $2,461 | $81,620 | $18,000 | $63,620 |
| 2022 | $2,104 | $69,320 | $16,000 | $53,320 |
| 2021 | $1,642 | $54,100 | $12,000 | $42,100 |
| 2020 | $1,874 | $47,020 | $12,000 | $35,020 |
| 2019 | $1,427 | $47,020 | $12,000 | $35,020 |
| 2018 | $1,417 | $46,680 | $10,400 | $36,280 |
| 2017 | $729 | $25,348 | $8,000 | $17,348 |
| 2016 | $729 | $25,348 | $8,000 | $17,348 |
| 2015 | $747 | $25,348 | $8,000 | $17,348 |
| 2014 | $753 | $25,348 | $0 | $0 |
Source: Public Records
Map
Nearby Homes
- 1545 Kennesaw Trace Ct NW
- 1856 Grant Ct NW
- 3455 Lee Ct NW Unit 2
- 3478 Lee Ct NW
- 1861 Grant Ct NW Unit 2
- 1115 Country Club Place NW
- 1135 Shiloh Ln NW
- 1418 Shiloh Way NW
- 3435 Grant Dr NW
- 3341 Verdi Ln
- 3322 Cranston Ln
- 1919 Appian Aly
- 1915 Cassia Aly
- 1920 Appian Aly
- 3374 Verdi Ln
- 3354 Cranston Ln
- 3352 Cranston Ln
- 3346 Cranston Ln
- 3344 Cranston Ln
- 3342 Cranston Ln
- 1525 Kennesaw Trace Ct NW Unit 1
- 1515 Kennesaw Trace Ct NW
- 1505 Kennesaw Trace Ct NW
- 1495 Kennesaw Trace Ct NW Unit 1
- 1485 Kennesaw Trace Ct NW Unit 1
- 1475 Kennesaw Trace Ct NW
- 3591 Kennesaw Station Dr NW Unit 3591
- 3591 Kennesaw Station Dr NW
- 1465 Kennesaw Trace Ct NW
- 1200 Kennesaw Trace Ct NW Unit 1
- 3589 Kennesaw Station Dr NW
- 3587 Kennesaw Station Dr NW
- 1210 Kennesaw Trace Ct NW Unit 1
- 1240 Kennesaw Trace Ct NW Unit 1
- 33536 Kennesaw Station Dr NW
- 1455 Kennesaw Trace Ct NW
- 1250 Kennesaw Trace Ct NW
- 1220 Kennesaw Trace Ct NW
- 1260 Kennesaw Trace Ct NW Unit 1
- 3585 Kennesaw Station Dr NW Unit 1