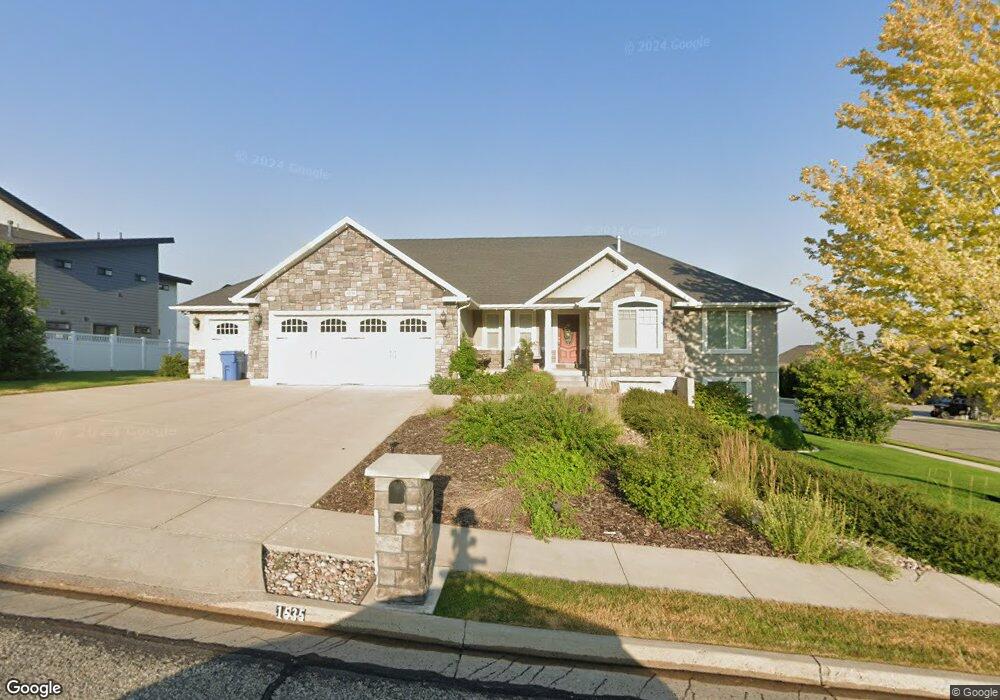
1535 N 1350 E North Logan, UT 84341
Estimated Value: $708,000 - $789,222
5
Beds
3
Baths
3,630
Sq Ft
$204/Sq Ft
Est. Value
About This Home
This home is located at 1535 N 1350 E, North Logan, UT 84341 and is currently estimated at $739,056, approximately $203 per square foot. 1535 N 1350 E is a home located in Cache County with nearby schools including Greenville School, Cedar Ridge School, and Cedar Ridge Middle School.
Ownership History
Date
Name
Owned For
Owner Type
Purchase Details
Closed on
Jun 11, 2014
Sold by
Robson Kent E and Robson Joan S
Bought by
Kent E Robson & Joan S Robson Living Tru and Robson Joan S
Current Estimated Value
Purchase Details
Closed on
Aug 19, 2005
Sold by
Owen Brothers Lc
Bought by
Cragun Trent
Home Financials for this Owner
Home Financials are based on the most recent Mortgage that was taken out on this home.
Original Mortgage
$41,700
Interest Rate
5.56%
Mortgage Type
Seller Take Back
Create a Home Valuation Report for This Property
The Home Valuation Report is an in-depth analysis detailing your home's value as well as a comparison with similar homes in the area
Home Values in the Area
Average Home Value in this Area
Purchase History
| Date | Buyer | Sale Price | Title Company |
|---|---|---|---|
| Kent E Robson & Joan S Robson Living Tru | -- | None Available | |
| Cragun Trent | -- | Cache Title Company |
Source: Public Records
Mortgage History
| Date | Status | Borrower | Loan Amount |
|---|---|---|---|
| Closed | Cragun Trent | $41,700 |
Source: Public Records
Tax History Compared to Growth
Tax History
| Year | Tax Paid | Tax Assessment Tax Assessment Total Assessment is a certain percentage of the fair market value that is determined by local assessors to be the total taxable value of land and additions on the property. | Land | Improvement |
|---|---|---|---|---|
| 2024 | $3,431 | $446,975 | $0 | $0 |
| 2023 | $3,396 | $413,975 | $0 | $0 |
| 2022 | $3,554 | $413,975 | $0 | $0 |
| 2021 | $3,434 | $620,145 | $90,000 | $530,145 |
| 2020 | $2,750 | $465,705 | $90,000 | $375,705 |
| 2019 | $2,880 | $465,705 | $90,000 | $375,705 |
| 2018 | $2,568 | $402,700 | $76,000 | $326,700 |
| 2017 | $2,486 | $205,150 | $0 | $0 |
| 2016 | $2,525 | $205,150 | $0 | $0 |
| 2015 | $2,419 | $195,855 | $0 | $0 |
| 2014 | $2,362 | $195,855 | $0 | $0 |
| 2013 | -- | $195,730 | $0 | $0 |
Source: Public Records
Map
Nearby Homes
- 1315 E 1550 N
- 1395 E Talmage Ln Unit 31
- 1285 E 1600 N
- 1561 N 1525 E
- 1440 N 1600 E
- 1575 N 1640 E
- 1357 E 1220 N
- 1235 N 1380 E
- 1336 E 1220 N
- 1729 Gateway Dr
- 1801 N 1700 E
- 1427 E 2060 N
- 2047 N 1350 E
- 1720 N 1850 E
- 1586 N Sharptail Cir
- 1891 E 1500 N
- 1902 E 1500 N
- 1809 E 1815 N
- 1405 N Aspen Dr
- 1451 N Aspen Dr