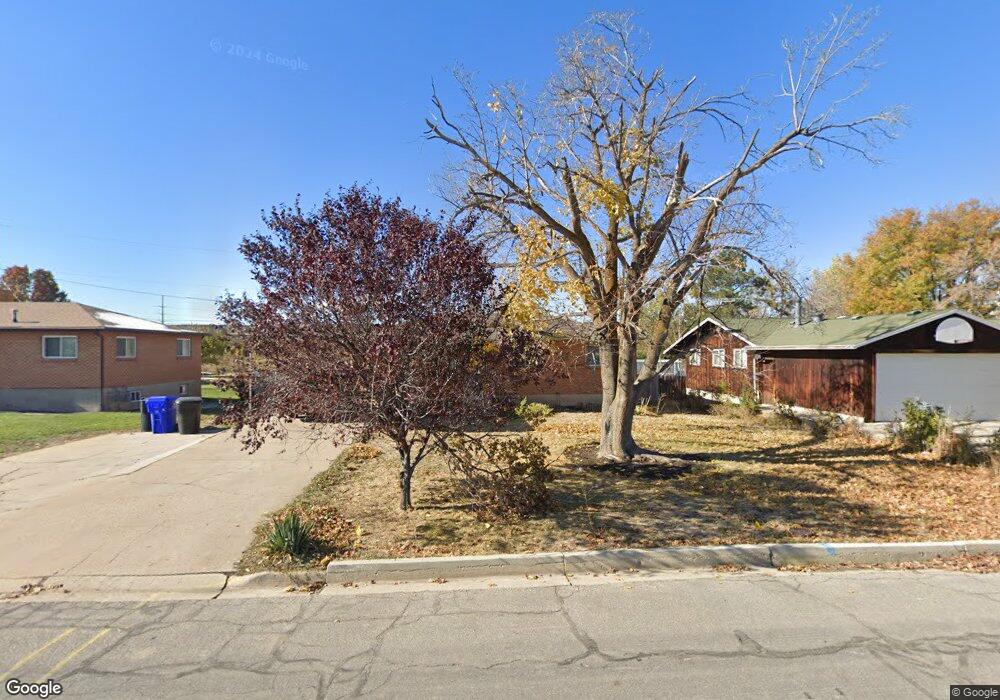
1535 N 400 W Bountiful, UT 84010
Estimated Value: $465,000 - $510,636
4
Beds
3
Baths
2,319
Sq Ft
$211/Sq Ft
Est. Value
About This Home
This home is located at 1535 N 400 W, Bountiful, UT 84010 and is currently estimated at $488,159, approximately $210 per square foot. 1535 N 400 W is a home located in Davis County with nearby schools including Meadowbrook Elementary School, Bountiful Junior High School, and Viewmont High School.
Ownership History
Date
Name
Owned For
Owner Type
Purchase Details
Closed on
Jan 29, 2016
Sold by
Bluemountain Inc
Bought by
Pitcher Kacey B and Pitcher Katherine C
Current Estimated Value
Purchase Details
Closed on
Mar 16, 2005
Sold by
Corbridge Patrick Wayne and Corbridge Judy Lynn
Bought by
Corbridge Patrick and Corbridge Judy
Home Financials for this Owner
Home Financials are based on the most recent Mortgage that was taken out on this home.
Original Mortgage
$120,950
Interest Rate
5.61%
Mortgage Type
New Conventional
Purchase Details
Closed on
Dec 19, 1997
Sold by
Bell Layne Stanley and Bell Cynthia
Bought by
Corbridge Patrick Wayne and Corbridge Judy Lynn
Home Financials for this Owner
Home Financials are based on the most recent Mortgage that was taken out on this home.
Original Mortgage
$125,784
Interest Rate
7.23%
Mortgage Type
FHA
Create a Home Valuation Report for This Property
The Home Valuation Report is an in-depth analysis detailing your home's value as well as a comparison with similar homes in the area
Purchase History
| Date | Buyer | Sale Price | Title Company |
|---|---|---|---|
| Pitcher Kacey B | -- | Founders Title | |
| Corbridge Patrick | -- | Inwest Title Services Inc | |
| Corbridge Patrick Wayne | -- | Associated Title Company |
Source: Public Records
Mortgage History
| Date | Status | Borrower | Loan Amount |
|---|---|---|---|
| Previous Owner | Corbridge Patrick | $120,950 | |
| Previous Owner | Corbridge Patrick Wayne | $125,784 |
Source: Public Records
Tax History
| Year | Tax Paid | Tax Assessment Tax Assessment Total Assessment is a certain percentage of the fair market value that is determined by local assessors to be the total taxable value of land and additions on the property. | Land | Improvement |
|---|---|---|---|---|
| 2025 | $3,214 | $254,100 | $138,507 | $115,593 |
| 2024 | $2,906 | $244,201 | $125,659 | $118,542 |
| 2023 | $2,842 | $433,000 | $229,443 | $203,557 |
| 2022 | $3,028 | $248,601 | $124,823 | $123,778 |
| 2021 | $2,566 | $353,000 | $163,433 | $189,567 |
| 2020 | $2,426 | $309,000 | $138,860 | $170,140 |
| 2019 | $2,336 | $301,000 | $141,657 | $159,343 |
| 2018 | $1,959 | $254,000 | $138,746 | $115,254 |
| 2016 | $1,544 | $112,750 | $59,029 | $53,721 |
| 2015 | $1,738 | $109,780 | $59,029 | $50,751 |
| 2014 | $1,523 | $108,430 | $59,029 | $49,401 |
| 2013 | -- | $99,865 | $36,190 | $63,675 |
Source: Public Records
Map
Nearby Homes
- 1625 Pages Place
- 1520 N 550 W
- 328 W Pages Ln
- 235 W 1400 N
- 204 Lyman Ln
- 1767 N 600 W
- 1260 N 200 W
- 366 W 1000 N
- 1130 N 200 W
- 951 Centerville Commons Way
- 96 Village Square Rd
- 184 Park Shadows Cir
- 324 S 600 W
- 287 S 680 W Unit 9
- 16 W 780 S
- 1420 N Main St
- 330 W Paradiso Ln
- 106 W 700 N
- 563 N 200 W
- 825 W 1320 N
Your Personal Tour Guide
Ask me questions while you tour the home.