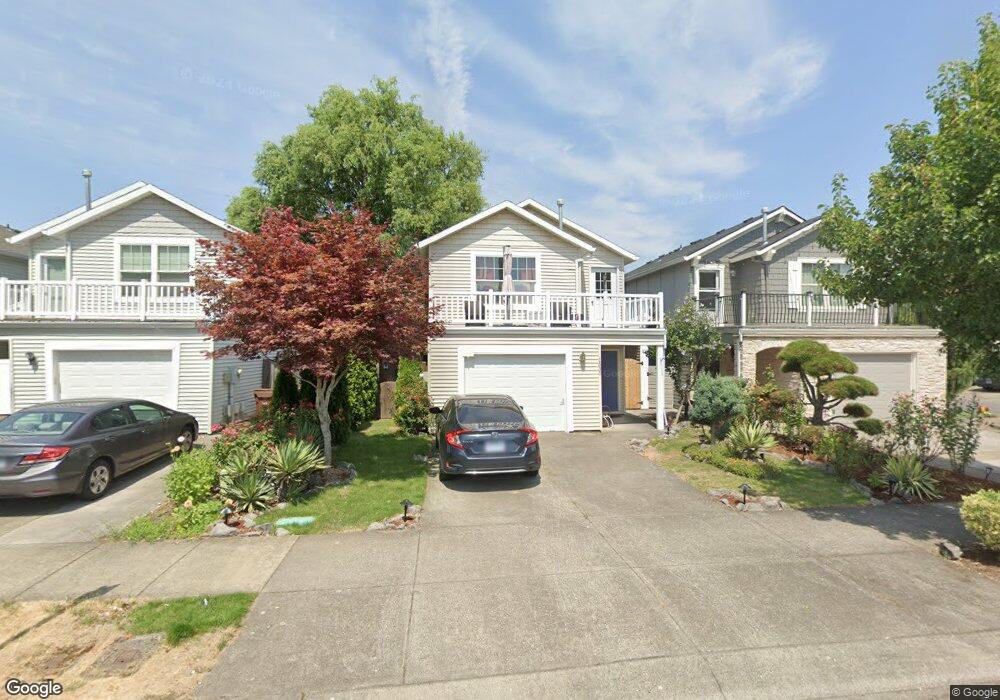
1535 NE Herrold Ct Hillsboro, OR 97124
Northwest Hillsboro NeighborhoodEstimated Value: $419,050 - $494,000
3
Beds
2
Baths
1,347
Sq Ft
$333/Sq Ft
Est. Value
About This Home
This home is located at 1535 NE Herrold Ct, Hillsboro, OR 97124 and is currently estimated at $449,013, approximately $333 per square foot. 1535 NE Herrold Ct is a home located in Washington County with nearby schools including Mooberry Elementary School, J.W. Poynter Middle School, and Liberty High School.
Ownership History
Date
Name
Owned For
Owner Type
Purchase Details
Closed on
Jan 12, 2015
Sold by
Keating Gregory P
Bought by
Mott Jeffrey Thomas
Current Estimated Value
Home Financials for this Owner
Home Financials are based on the most recent Mortgage that was taken out on this home.
Original Mortgage
$190,475
Outstanding Balance
$106,905
Interest Rate
3.82%
Mortgage Type
New Conventional
Estimated Equity
$342,108
Purchase Details
Closed on
Aug 5, 2014
Sold by
Monroe Marella L
Bought by
Keating Gregory P
Purchase Details
Closed on
Dec 27, 2001
Sold by
Us Best Mtg Inc
Bought by
Monroe Marella L
Home Financials for this Owner
Home Financials are based on the most recent Mortgage that was taken out on this home.
Original Mortgage
$139,018
Interest Rate
6.51%
Mortgage Type
FHA
Purchase Details
Closed on
Oct 22, 2001
Sold by
Oberst Norma Jean and Oberst Carl W
Bought by
U S Best Mtg Inc and Us Best Homes
Create a Home Valuation Report for This Property
The Home Valuation Report is an in-depth analysis detailing your home's value as well as a comparison with similar homes in the area
Home Values in the Area
Average Home Value in this Area
Purchase History
| Date | Buyer | Sale Price | Title Company |
|---|---|---|---|
| Mott Jeffrey Thomas | $202,500 | Wfg Title | |
| Keating Gregory P | $194,500 | Lawyers Title | |
| Monroe Marella L | $141,200 | First American | |
| U S Best Mtg Inc | $17,000 | First American |
Source: Public Records
Mortgage History
| Date | Status | Borrower | Loan Amount |
|---|---|---|---|
| Open | Mott Jeffrey Thomas | $190,475 | |
| Previous Owner | Monroe Marella L | $139,018 |
Source: Public Records
Tax History Compared to Growth
Tax History
| Year | Tax Paid | Tax Assessment Tax Assessment Total Assessment is a certain percentage of the fair market value that is determined by local assessors to be the total taxable value of land and additions on the property. | Land | Improvement |
|---|---|---|---|---|
| 2025 | $3,543 | $216,730 | -- | -- |
| 2024 | $3,442 | $210,420 | -- | -- |
| 2023 | $3,442 | $204,300 | $0 | $0 |
| 2022 | $3,349 | $204,300 | $0 | $0 |
| 2021 | $3,281 | $192,580 | $0 | $0 |
| 2020 | $3,211 | $186,980 | $0 | $0 |
| 2019 | $3,119 | $181,540 | $0 | $0 |
| 2018 | $2,985 | $176,260 | $0 | $0 |
| 2017 | $2,877 | $171,130 | $0 | $0 |
| 2016 | $2,798 | $166,150 | $0 | $0 |
| 2015 | $2,686 | $161,320 | $0 | $0 |
| 2014 | $2,670 | $156,630 | $0 | $0 |
Source: Public Records
Map
Nearby Homes
- 1455 NE Jessica Loop
- 1450 NE Sunrise Ln
- 1442 NE 14th Ave
- 1740 NE Darby St
- 2080 NE Darby St
- 1822 NE Barberry Dr
- 2136 NE 13th Ave
- 1239 NE Setting Sun Dr
- 1269 NE Grant St
- 1303 NE Cornell Rd
- 773 NE Kathryn St
- 461 NE 16th Ave
- 1670 NE Jackson School Rd
- 1722 NE Jackson School Rd
- 1900 NE Harewood Place
- 2525 NE Charlois Dr
- 1184 NE Turner Dr
- 1043 NE Sturgess Ave
- 2619 NE Charlois Dr
- 2570 NE Grant St
- 1523 NE Herrold Ct
- 1543 NE Herrold Ct
- 1515 NE Herrold Ct
- 1536 NE Jessica Loop
- 1544 NE Jessica Loop
- 1524 NE Jessica Loop
- 1507 NE Herrold Ct
- 1518 NE Jessica Loop
- 1605 NE Jessica Loop
- 1611 NE Jessica Loop
- 1510 NE Jessica Loop
- 1501 NE Herrold Ct
- 1595 NE Jessica Loop
- 1524 NE Herrold Ct
- 1540 NE Herrold Ct
- 1516 NE Herrold Ct
- 1502 NE Jessica Loop
- 1508 NE Herrold Ct
- 1583 NE Jessica Loop