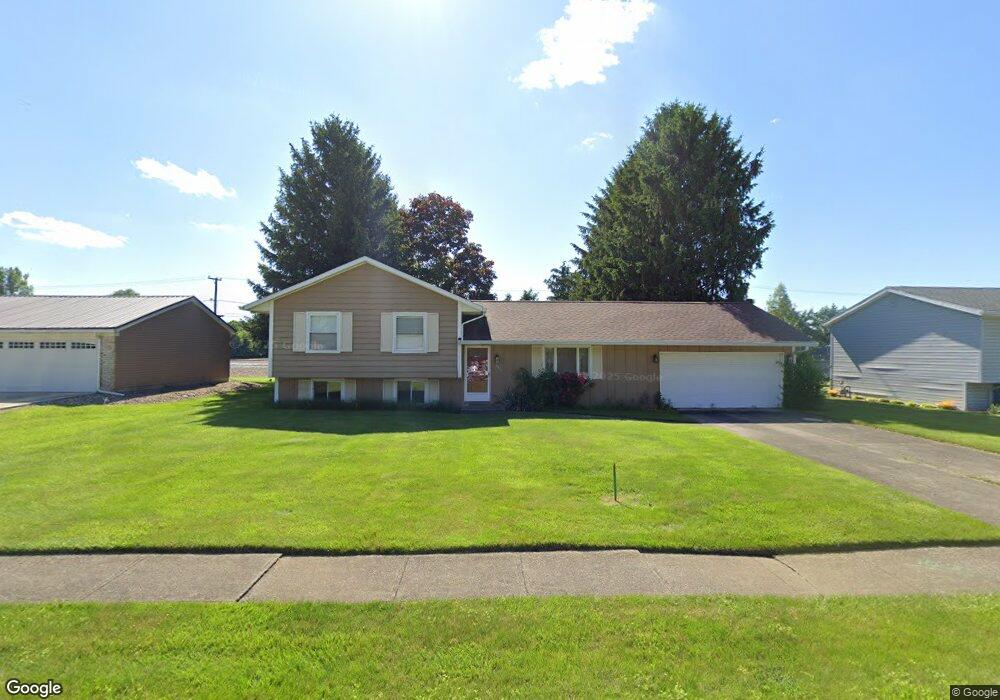
1535 Rosedale Ave Bucyrus, OH 44820
Estimated Value: $179,152 - $215,000
3
Beds
2
Baths
1,575
Sq Ft
$123/Sq Ft
Est. Value
About This Home
This home is located at 1535 Rosedale Ave, Bucyrus, OH 44820 and is currently estimated at $193,788, approximately $123 per square foot. 1535 Rosedale Ave is a home located in Crawford County with nearby schools including Bucyrus Elementary School, Bucyrus Secondary School, and Wayside Christian School.
Ownership History
Date
Name
Owned For
Owner Type
Purchase Details
Closed on
Oct 24, 2024
Sold by
Ornelas Debra Elise Crawford
Bought by
Sutton Allison Suzanne
Current Estimated Value
Home Financials for this Owner
Home Financials are based on the most recent Mortgage that was taken out on this home.
Original Mortgage
$200,505
Outstanding Balance
$198,498
Interest Rate
6.09%
Mortgage Type
New Conventional
Estimated Equity
-$4,710
Purchase Details
Closed on
Jun 25, 2010
Sold by
Swisher Angela L and Wise Angela L
Bought by
Ornelas Debra Elise Crawford
Purchase Details
Closed on
Jun 19, 2009
Sold by
Wise Angela L and Wise David E
Bought by
Ornelas Debra Elise Crawford
Purchase Details
Closed on
Jun 30, 2008
Sold by
Lutz Custom Homes Llc
Bought by
Swisher Angela L
Purchase Details
Closed on
May 20, 2008
Sold by
Beach Sammy K
Bought by
Lutz Customhomes Llc
Create a Home Valuation Report for This Property
The Home Valuation Report is an in-depth analysis detailing your home's value as well as a comparison with similar homes in the area
Home Values in the Area
Average Home Value in this Area
Purchase History
| Date | Buyer | Sale Price | Title Company |
|---|---|---|---|
| Sutton Allison Suzanne | $198,500 | American Title | |
| Ornelas Debra Elise Crawford | $110,000 | -- | |
| Ornelas Debra Elise Crawford | $112,000 | -- | |
| Swisher Angela L | $106,500 | -- | |
| Lutz Customhomes Llc | $100,000 | -- |
Source: Public Records
Mortgage History
| Date | Status | Borrower | Loan Amount |
|---|---|---|---|
| Open | Sutton Allison Suzanne | $200,505 |
Source: Public Records
Tax History Compared to Growth
Tax History
| Year | Tax Paid | Tax Assessment Tax Assessment Total Assessment is a certain percentage of the fair market value that is determined by local assessors to be the total taxable value of land and additions on the property. | Land | Improvement |
|---|---|---|---|---|
| 2024 | $2,117 | $46,920 | $4,690 | $42,230 |
| 2023 | $2,117 | $33,530 | $3,560 | $29,970 |
| 2022 | $1,789 | $33,530 | $3,560 | $29,970 |
| 2021 | $1,785 | $33,530 | $3,560 | $29,970 |
| 2020 | $1,664 | $29,620 | $3,560 | $26,060 |
| 2019 | $1,701 | $29,620 | $3,560 | $26,060 |
| 2018 | $1,693 | $29,620 | $3,560 | $26,060 |
| 2017 | $1,604 | $27,080 | $3,560 | $23,520 |
| 2016 | $1,555 | $27,080 | $3,560 | $23,520 |
| 2015 | $1,533 | $27,080 | $3,560 | $23,520 |
| 2014 | $1,527 | $27,080 | $3,560 | $23,520 |
| 2013 | $1,527 | $27,080 | $3,560 | $23,520 |
Source: Public Records
Map
Nearby Homes
- 1555 Rosedale Ave
- 1315 Lynne Ave
- 0 Lynne Ave
- 1145 Lynne Ave
- 452 Pleasant Ln
- 1123 Hillcrest Dr
- 1149 Farmview Dr
- 1112 Hillcrest Dr
- 2440 Wyandot Rd
- 1211 S Sandusky Ave
- 130 Brentwood St
- 275 Brentwood St
- 900 S Spring St
- 1021 S Sandusky Ave
- 318 Charlotte St
- 325 W Liberty St
- 708 S Sandusky Ave
- 419 Short St
- 583 Rogers St
- 550 S Walnut St
- 1525 Rosedale Ave
- 1565 Rosedale Ave
- 1540 Rosedale Ave
- 1550 Rosedale Ave
- 1530 Rosedale Ave
- 1560 Rosedale Ave
- 1505 Rosedale Ave
- 1520 Rosedale Ave
- 1585 Rosedale Ave
- 1570 Rosedale Ave
- 925 Sunset Dr
- 1521 Linwood Dr
- 1531 Linwood Dr
- 1515 Linwood Dr
- 1590 Rosedale Ave
- 1537 Linwood Dr
- 1493 Rosedale Ave
- 1547 Linwood Dr
- 1503 Linwood Dr
- 1473 Rosedale Ave