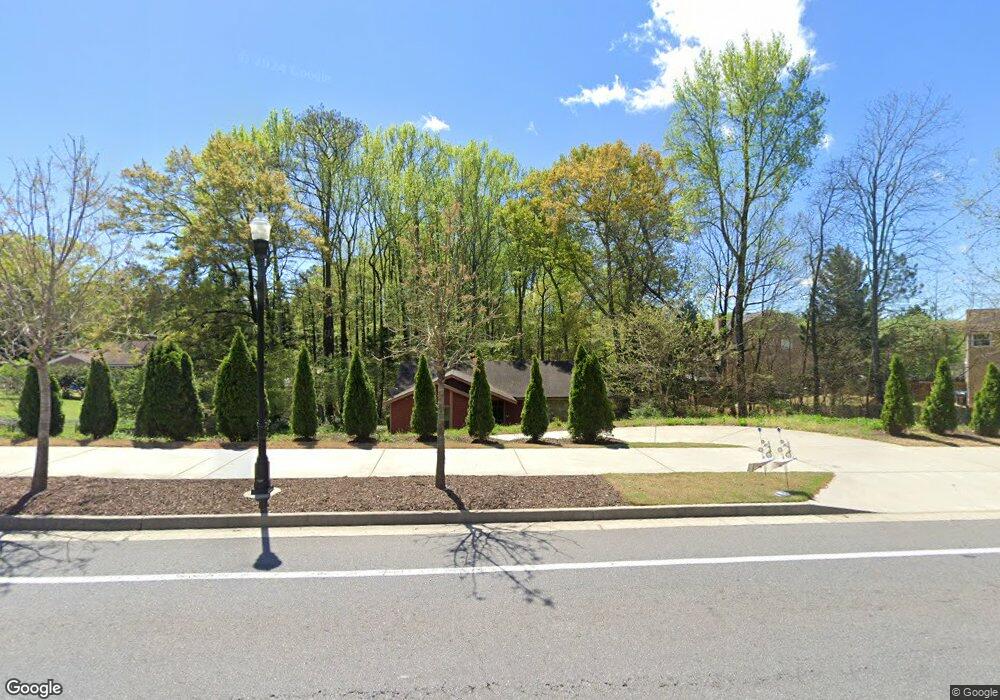
1535 Rucker Rd Alpharetta, GA 30009
Estimated Value: $600,975 - $638,000
3
Beds
3
Baths
1,716
Sq Ft
$361/Sq Ft
Est. Value
About This Home
This home is located at 1535 Rucker Rd, Alpharetta, GA 30009 and is currently estimated at $619,744, approximately $361 per square foot. 1535 Rucker Rd is a home located in Fulton County with nearby schools including Hembree Springs Elementary School, Northwestern Middle School, and Milton High School.
Ownership History
Date
Name
Owned For
Owner Type
Purchase Details
Closed on
Oct 11, 2024
Sold by
Burke Michael Murphy
Bought by
Burke Michael M
Current Estimated Value
Purchase Details
Closed on
Oct 24, 2022
Sold by
Burke Michael M
Bought by
Murphy Burke Michael
Purchase Details
Closed on
Feb 13, 2002
Sold by
Burke Michael M
Bought by
Burke Michael M
Purchase Details
Closed on
Feb 11, 1994
Sold by
Perry Robert A Susan C
Bought by
Burke Michael M
Home Financials for this Owner
Home Financials are based on the most recent Mortgage that was taken out on this home.
Original Mortgage
$84,151
Interest Rate
7.02%
Mortgage Type
FHA
Create a Home Valuation Report for This Property
The Home Valuation Report is an in-depth analysis detailing your home's value as well as a comparison with similar homes in the area
Home Values in the Area
Average Home Value in this Area
Purchase History
| Date | Buyer | Sale Price | Title Company |
|---|---|---|---|
| Burke Michael M | -- | -- | |
| Murphy Burke Michael | -- | -- | |
| Burke Michael M | -- | -- | |
| Burke Michael M | $85,500 | -- |
Source: Public Records
Mortgage History
| Date | Status | Borrower | Loan Amount |
|---|---|---|---|
| Previous Owner | Burke Michael M | $84,151 |
Source: Public Records
Tax History Compared to Growth
Tax History
| Year | Tax Paid | Tax Assessment Tax Assessment Total Assessment is a certain percentage of the fair market value that is determined by local assessors to be the total taxable value of land and additions on the property. | Land | Improvement |
|---|---|---|---|---|
| 2025 | $305 | $172,360 | $82,120 | $90,240 |
| 2023 | $5,503 | $194,960 | $82,120 | $112,840 |
| 2022 | $1,732 | $130,600 | $36,600 | $94,000 |
| 2021 | $1,945 | $120,440 | $31,320 | $89,120 |
| 2020 | $1,949 | $114,640 | $29,840 | $84,800 |
| 2019 | $253 | $124,840 | $28,640 | $96,200 |
| 2018 | $2,487 | $112,640 | $38,560 | $74,080 |
| 2017 | $1,568 | $65,680 | $17,240 | $48,440 |
| 2016 | $1,566 | $65,680 | $17,240 | $48,440 |
| 2015 | $1,750 | $65,680 | $17,240 | $48,440 |
| 2014 | $1,623 | $65,680 | $17,240 | $48,440 |
Source: Public Records
Map
Nearby Homes
- 1530 Rucker Rd
- 1614 Rucker Rd
- 170 Michaela Dr
- 1413 Bellsmith Dr
- 1386 Bellsmith Dr
- 116 Emily Ln
- 531 S Main St Unit 210
- 531 S Main St Unit 320
- 531 S Main St Unit 330
- 531 S Main St Unit 410
- Hillstone with Basement Plan at Emberly - Monarch Collection
- Rockmart Elite Plan at Emberly - Mariposa Collection
- Rockmart Plan at Emberly - Mariposa Collection
- Hedgewood with Basement Plan at Emberly - Monarch Collection
- Hedgewood Plan at Emberly - Monarch Collection
- Hillstone Plan at Emberly - Monarch Collection
- Rockmart Grand Plan at Emberly - Mariposa Collection
- Antoinette with Basement Plan at Emberly - Monarch Collection
- Antoinette Plan at Emberly - Monarch Collection
- 3052 Steeplechase
- 600 Daintree Dr
- 101 Arrowood Ln
- 590 Daintree Dr
- 310 Canberra Way
- 121 Arrowood Ln
- 1540 Rucker Rd
- 580 Daintree Dr
- 131 Arrowood Ln
- 320 Canberra Way
- 1550 Rucker Rd
- 545 Daintree Dr
- 300 Canberra Way
- 141 Arrowood Ln
- 570 Daintree Dr
- 1560 Rucker Rd
- 315 Canberra Way
- 0 Canberra Way
- 1604 Rucker Rd
- 0 Arrowood Ct Unit 20 8368118
- 0 Arrowood Ct Unit 6002101