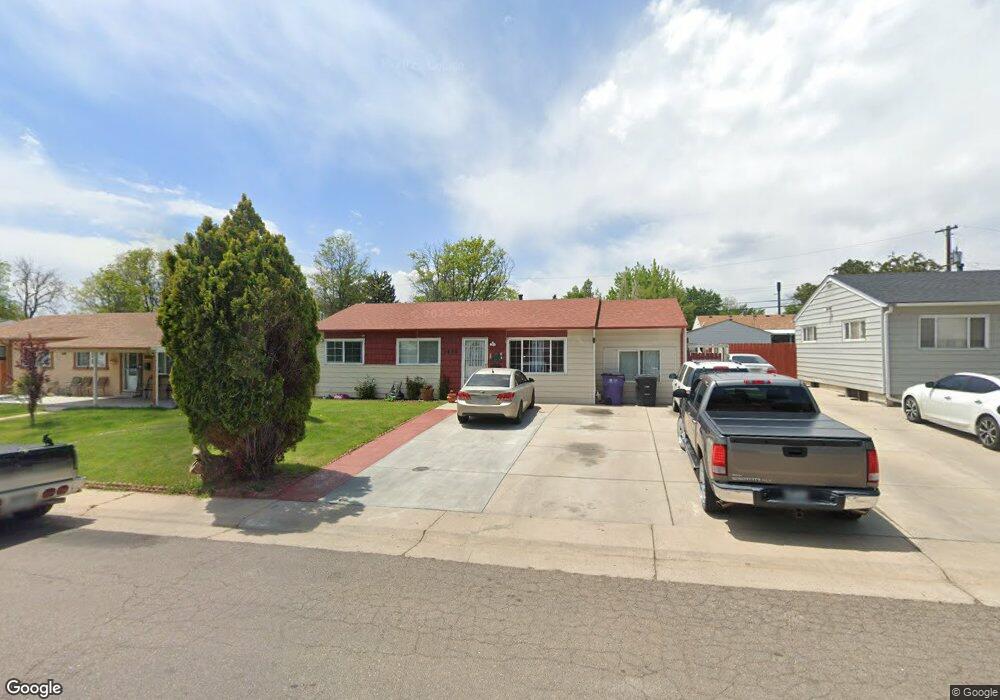
1535 S King St Denver, CO 80219
Mar Lee NeighborhoodEstimated Value: $418,492 - $503,000
4
Beds
1
Bath
1,245
Sq Ft
$371/Sq Ft
Est. Value
About This Home
This home is located at 1535 S King St, Denver, CO 80219 and is currently estimated at $462,373, approximately $371 per square foot. 1535 S King St is a home located in Denver County with nearby schools including Johnson Elementary School, Kepner Beacon Middle School, and West High School.
Ownership History
Date
Name
Owned For
Owner Type
Purchase Details
Closed on
Jul 17, 2002
Sold by
Guadian Lopez Nestor and Guadian Perez Jose
Bought by
Lopez Nestor
Current Estimated Value
Home Financials for this Owner
Home Financials are based on the most recent Mortgage that was taken out on this home.
Original Mortgage
$126,000
Outstanding Balance
$53,073
Interest Rate
6.62%
Estimated Equity
$409,300
Purchase Details
Closed on
Jul 30, 1999
Sold by
Cobb Michael Dale
Bought by
Guadian Lopez Nestor and Guadian Perez Jose
Home Financials for this Owner
Home Financials are based on the most recent Mortgage that was taken out on this home.
Original Mortgage
$123,700
Interest Rate
7.71%
Mortgage Type
FHA
Purchase Details
Closed on
Mar 24, 1998
Sold by
Dale Stahl Renee Ann and Dale Michael
Bought by
Cobb Michael Dale
Home Financials for this Owner
Home Financials are based on the most recent Mortgage that was taken out on this home.
Original Mortgage
$84,293
Interest Rate
7.04%
Mortgage Type
FHA
Create a Home Valuation Report for This Property
The Home Valuation Report is an in-depth analysis detailing your home's value as well as a comparison with similar homes in the area
Home Values in the Area
Average Home Value in this Area
Purchase History
| Date | Buyer | Sale Price | Title Company |
|---|---|---|---|
| Lopez Nestor | -- | Chicago Title Co | |
| Guadian Lopez Nestor | $124,900 | -- | |
| Cobb Michael Dale | -- | -- |
Source: Public Records
Mortgage History
| Date | Status | Borrower | Loan Amount |
|---|---|---|---|
| Open | Lopez Nestor | $126,000 | |
| Closed | Guadian Lopez Nestor | $123,700 | |
| Previous Owner | Cobb Michael Dale | $84,293 |
Source: Public Records
Tax History Compared to Growth
Tax History
| Year | Tax Paid | Tax Assessment Tax Assessment Total Assessment is a certain percentage of the fair market value that is determined by local assessors to be the total taxable value of land and additions on the property. | Land | Improvement |
|---|---|---|---|---|
| 2024 | $2,014 | $25,430 | $3,120 | $22,310 |
| 2023 | $1,970 | $25,430 | $3,120 | $22,310 |
| 2022 | $1,681 | $21,140 | $7,060 | $14,080 |
| 2021 | $1,623 | $21,750 | $7,260 | $14,490 |
| 2020 | $1,543 | $20,790 | $6,840 | $13,950 |
| 2019 | $1,499 | $20,790 | $6,840 | $13,950 |
| 2018 | $1,264 | $16,340 | $6,030 | $10,310 |
| 2017 | $1,260 | $16,340 | $6,030 | $10,310 |
| 2016 | $1,048 | $12,850 | $4,282 | $8,568 |
| 2015 | $1,004 | $12,850 | $4,282 | $8,568 |
| 2014 | $712 | $8,570 | $2,380 | $6,190 |
Source: Public Records
Map
Nearby Homes
- 1516 S Lowell Blvd
- 995 S Lowell Blvd
- 1589 S Michigan Way
- 1431 S Meade St
- 3300 W Florida Ave Unit 35
- 3300 W Florida Ave Unit 36
- 364 S Newton St
- 419 S Osceola St
- 415 S Osceola St
- 405 S Osceola St
- 1562 S Osceola Way
- 3333 W Arkansas Ave
- 1561 S Patton Ct
- 1624 S Patton Ct
- 990 S Meade St
- 1358 S Irving St Unit 9
- 1358 S Irving St Unit 53
- 1680 S Patton Ct
- 3245 W Mexico Ave
- 1532 S Quitman St
- 1543 S King St
- 1527 S King St
- 1532 S Lowell Blvd
- 1553 S King St
- 1519 S King St
- 1540 S Lowell Blvd
- 1546 S King St
- 1538 S King St
- 1548 S Lowell Blvd
- 1528 S King St
- 1524 S Lowell Blvd
- 1561 S King St
- 1556 S King St
- 1511 S King St
- 1520 S King St
- 1560 S Lowell Blvd
- 1508 S Lowell Blvd
- 1510 S King St
- 1564 S King St
- 1569 S King St