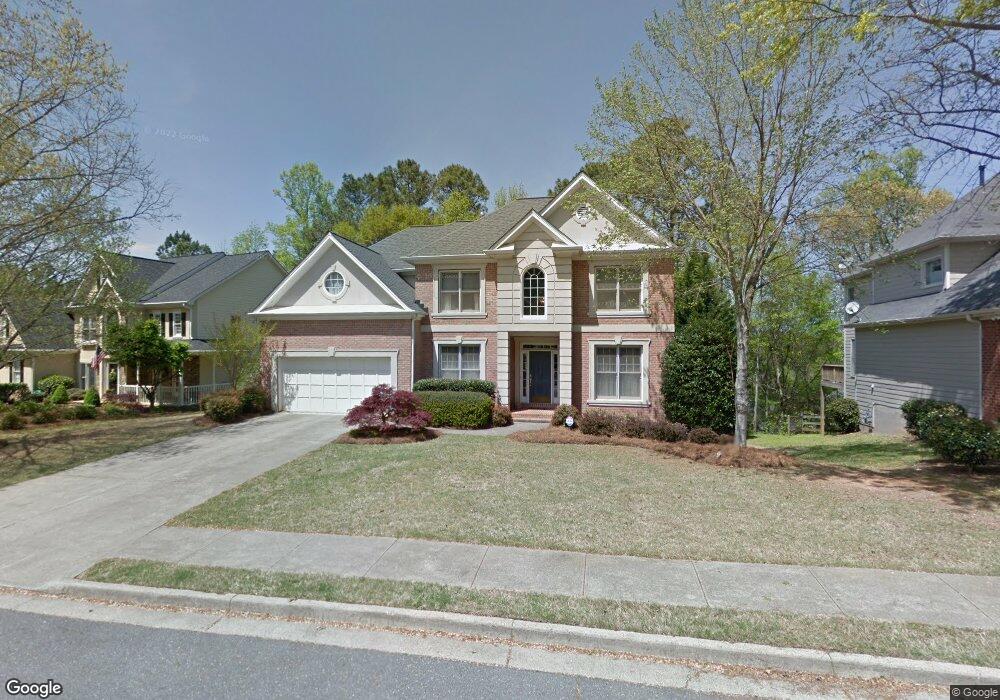
1535 Wynridge Pointe Path Alpharetta, GA 30005
Windward NeighborhoodEstimated Value: $830,000 - $862,000
4
Beds
4
Baths
2,688
Sq Ft
$315/Sq Ft
Est. Value
About This Home
This home is located at 1535 Wynridge Pointe Path, Alpharetta, GA 30005 and is currently estimated at $847,042, approximately $315 per square foot. 1535 Wynridge Pointe Path is a home located in Fulton County with nearby schools including Creek View Elementary School, Webb Bridge Middle School, and Alpharetta High School.
Ownership History
Date
Name
Owned For
Owner Type
Purchase Details
Closed on
Jul 29, 2015
Sold by
Lenich Stephen A
Bought by
Kardel Joseph H and Kardel Kathleen
Current Estimated Value
Home Financials for this Owner
Home Financials are based on the most recent Mortgage that was taken out on this home.
Original Mortgage
$328,000
Outstanding Balance
$258,670
Interest Rate
4.11%
Mortgage Type
New Conventional
Estimated Equity
$588,372
Purchase Details
Closed on
Oct 4, 2002
Sold by
Wiley Timothy and Wiley Beverly S
Bought by
Lenich Stephen A and Lenich Constance D
Home Financials for this Owner
Home Financials are based on the most recent Mortgage that was taken out on this home.
Original Mortgage
$271,920
Interest Rate
6.21%
Mortgage Type
New Conventional
Purchase Details
Closed on
Sep 1, 1994
Sold by
Highland Homes Inc
Bought by
Wiley Timothy Beverly S
Home Financials for this Owner
Home Financials are based on the most recent Mortgage that was taken out on this home.
Original Mortgage
$187,120
Interest Rate
6.87%
Create a Home Valuation Report for This Property
The Home Valuation Report is an in-depth analysis detailing your home's value as well as a comparison with similar homes in the area
Home Values in the Area
Average Home Value in this Area
Purchase History
| Date | Buyer | Sale Price | Title Company |
|---|---|---|---|
| Kardel Joseph H | $410,000 | -- | |
| Lenich Stephen A | $339,900 | -- | |
| Wiley Timothy Beverly S | $283,900 | -- |
Source: Public Records
Mortgage History
| Date | Status | Borrower | Loan Amount |
|---|---|---|---|
| Open | Kardel Joseph H | $328,000 | |
| Previous Owner | Lenich Stephen A | $271,920 | |
| Previous Owner | Wiley Timothy Beverly S | $187,120 |
Source: Public Records
Tax History Compared to Growth
Tax History
| Year | Tax Paid | Tax Assessment Tax Assessment Total Assessment is a certain percentage of the fair market value that is determined by local assessors to be the total taxable value of land and additions on the property. | Land | Improvement |
|---|---|---|---|---|
| 2025 | $963 | $326,160 | $78,360 | $247,800 |
| 2023 | $8,153 | $288,840 | $83,720 | $205,120 |
| 2022 | $4,474 | $259,800 | $53,560 | $206,240 |
| 2021 | $5,243 | $179,480 | $34,800 | $144,680 |
| 2020 | $5,275 | $177,360 | $34,400 | $142,960 |
| 2019 | $773 | $167,880 | $34,200 | $133,680 |
| 2018 | $4,730 | $187,640 | $20,160 | $167,480 |
| 2017 | $4,417 | $164,000 | $31,400 | $132,600 |
| 2016 | $4,395 | $164,000 | $31,400 | $132,600 |
| 2015 | $4,774 | $160,080 | $30,680 | $129,400 |
| 2014 | $3,801 | $140,440 | $26,920 | $113,520 |
Source: Public Records
Map
Nearby Homes
- 1065 Beacon Hill Crossing
- 7840 Willoughby Ct
- 7845 Crownpoint Dr
- 7535 Jamestown Dr
- 7875 Pierpoint Ln
- 7330 Winthrop Rd
- 12981 Dartmore Cir
- 13042 Dartmore Ave
- 270 Ardsley Ln
- 6930 Whitman Walk
- 6710 Pippin Walk
- 6645 Cortland Walk
- 1230 Greatwood Manor
- 6515 Cortland Walk
- 6370 Cortland Walk
- 10 Club Ct
- 6785 Pippin Walk
- 6460 Cortland Walk
- 425 Fieldstone Landing
- 1200 Bay Pointe Terrace
- 1535 Wynridge Pointe
- 1525 Wynridge Pointe
- 1545 Wynridge Pointe
- 1710 Wynridge Path
- 1515 Wynridge Point
- 1515 Wynridge Pointe
- 1555 Wynridge Point
- 1700 Wynridge Path
- 1530 Wynridge Pointe
- 1520 Wynridge Point
- 1555 Wynridge Pointe
- 1520 Wynridge Pointe
- 1540 Wynridge Pointe
- 1510 Wynridge Pointe
- 1550 Wynridge Pointe
- 1695 Wynridge Path
- 1030 Wynridge Crossing
- 1560 Wynridge Pointe Path
- 1500 Wynridge Pointe
- 1690 Wynridge Path