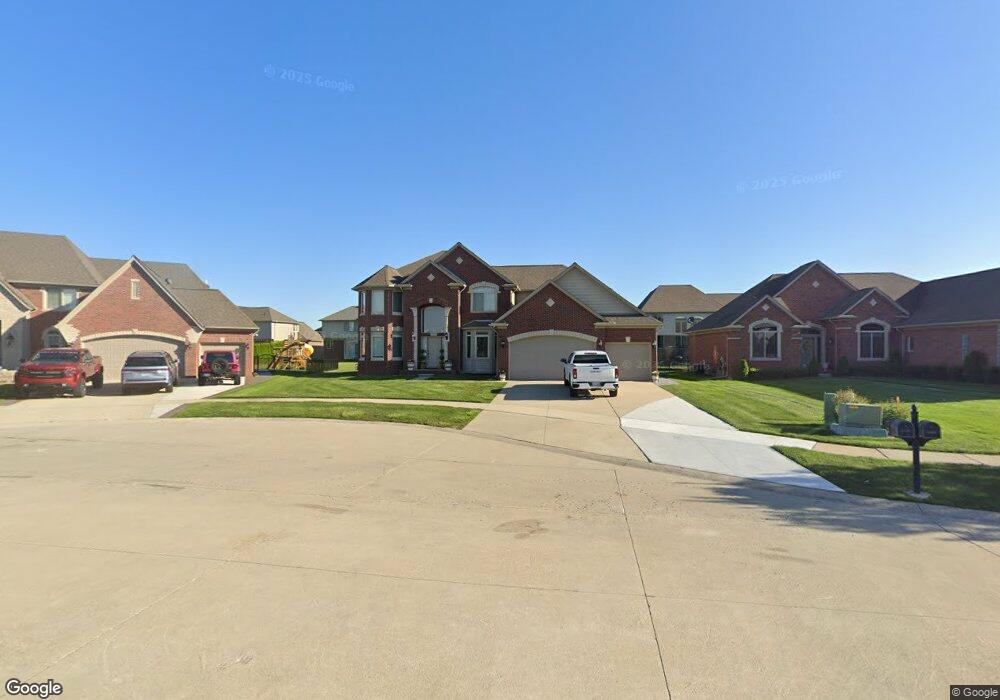
15357 Prentice Curt Macomb, MI 48042
Estimated Value: $597,000 - $762,000
4
Beds
4
Baths
3,243
Sq Ft
$213/Sq Ft
Est. Value
About This Home
This home is located at 15357 Prentice Curt, Macomb, MI 48042 and is currently estimated at $689,811, approximately $212 per square foot. 15357 Prentice Curt is a home located in Macomb County with nearby schools including Beck Centennial Elementary School, Shelby Junior High School, and Eisenhower High School.
Ownership History
Date
Name
Owned For
Owner Type
Purchase Details
Closed on
Mar 23, 2022
Sold by
Fakhouri Samer
Bought by
Abbo Bashar and Shaba Nagwa
Current Estimated Value
Home Financials for this Owner
Home Financials are based on the most recent Mortgage that was taken out on this home.
Original Mortgage
$430,000
Outstanding Balance
$400,703
Interest Rate
3.69%
Mortgage Type
New Conventional
Estimated Equity
$289,108
Purchase Details
Closed on
Apr 22, 2021
Sold by
Fakhoari Samer and Fakhoari Vivian
Bought by
Farhouri Samer
Purchase Details
Closed on
Oct 16, 2015
Sold by
Sal Mar Gateway Village Estates Inc
Bought by
Fakhouri Samer I and Fakhouri Vivian
Create a Home Valuation Report for This Property
The Home Valuation Report is an in-depth analysis detailing your home's value as well as a comparison with similar homes in the area
Home Values in the Area
Average Home Value in this Area
Purchase History
| Date | Buyer | Sale Price | Title Company |
|---|---|---|---|
| Abbo Bashar | $630,000 | None Listed On Document | |
| Abbo Bashar | $630,000 | None Listed On Document | |
| Farhouri Samer | -- | None Available | |
| Fakhouri Samer I | $414,975 | Visionary Title Agency Llc |
Source: Public Records
Mortgage History
| Date | Status | Borrower | Loan Amount |
|---|---|---|---|
| Open | Abbo Bashar | $430,000 |
Source: Public Records
Tax History
| Year | Tax Paid | Tax Assessment Tax Assessment Total Assessment is a certain percentage of the fair market value that is determined by local assessors to be the total taxable value of land and additions on the property. | Land | Improvement |
|---|---|---|---|---|
| 2025 | $5,084 | $294,400 | $0 | $0 |
| 2024 | $49 | $290,700 | $0 | $0 |
| 2023 | $4,686 | $258,800 | $0 | $0 |
| 2022 | $5,807 | $232,300 | $0 | $0 |
| 2021 | $5,649 | $226,500 | $0 | $0 |
| 2020 | $3,647 | $217,100 | $0 | $0 |
| 2019 | $5,187 | $213,600 | $0 | $0 |
| 2018 | $5,131 | $202,100 | $0 | $0 |
| 2017 | $5,045 | $185,040 | $34,500 | $150,540 |
| 2016 | $4,751 | $185,040 | $0 | $0 |
| 2015 | $1,248 | $134,690 | $0 | $0 |
| 2014 | $1,248 | $23,500 | $23,500 | $0 |
| 2011 | -- | $20,500 | $20,500 | $0 |
Source: Public Records
Map
Nearby Homes
- 53456 Fitzgerald Dr
- 53428 Gregory Dr
- 54680 Chickasaw Dr
- 16448 Trailway Dr
- 52522 Charing Way
- 14345 24 Mile Rd
- 54676 Carnation Dr
- 52204 Antler Dr
- 54990 Sherwood Ln
- 53987 Trent River Dr
- 52921 Royal Park Ave
- 16102 Thames Ln
- 52801 Royal Park Ave
- 13848 Woodsett Ct
- 54395 White Spruce Ln
- 54582 Ashley Lauren Dr
- 52163 Heatherstone Ave
- 16767 Cobblestone West Blvd
- 16701 25 Mile Rd
- 52244 Stoneridge Unit 121
- 15357 Prentice Ct
- 15383 Prentice Ct
- 15331 Prentice Ct Unit Lot 44
- 15331 Prentice Ct
- 15342 Amberfield Dr Unit Lot 40
- 15368 Amberfield Dr
- 15316 Amberfield Dr
- 15330 Prentice Ct Unit Lot #45
- 15290 Amberfield Dr Unit Lot #38
- 15290 Amberfield Dr
- 15408 Prentice Ct
- 15382 Prentice Ct
- 15382 Prentice Ct Unit Lot 47
- 53504 Fitzgerald Dr
- 15356 Prentice Ct
- 53528 Fitzgerald Dr
- 53482 Addington Dr Unit Lot 56
- 53482 Addington Dr
- 53554 Addington Dr
- 15357 Amberfield Dr
Your Personal Tour Guide
Ask me questions while you tour the home.