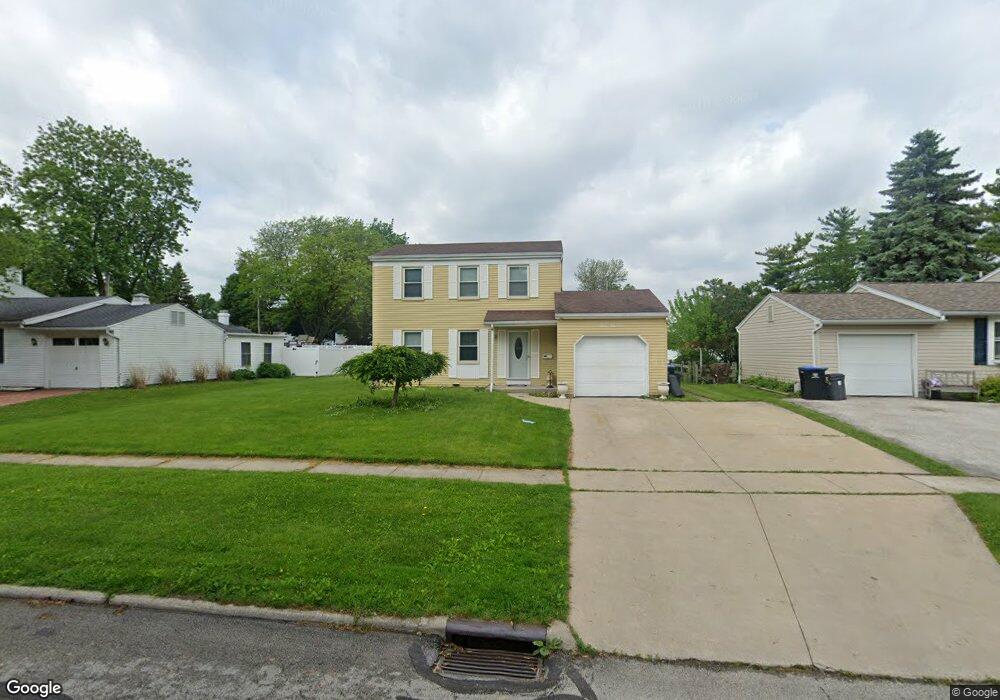
1536 Forrester Dr Oregon, OH 43616
Estimated Value: $212,000 - $253,000
3
Beds
2
Baths
1,248
Sq Ft
$180/Sq Ft
Est. Value
About This Home
This home is located at 1536 Forrester Dr, Oregon, OH 43616 and is currently estimated at $225,159, approximately $180 per square foot. 1536 Forrester Dr is a home located in Lucas County with nearby schools including St. Kateri Catholic Schools.
Ownership History
Date
Name
Owned For
Owner Type
Purchase Details
Closed on
Jul 26, 2016
Sold by
Kimbrell Vicente H and Kimbrell Angel
Bought by
Deluna Elena
Current Estimated Value
Home Financials for this Owner
Home Financials are based on the most recent Mortgage that was taken out on this home.
Original Mortgage
$96,662
Outstanding Balance
$79,332
Interest Rate
4.4%
Mortgage Type
FHA
Estimated Equity
$145,827
Purchase Details
Closed on
Nov 14, 2008
Sold by
Federal Home Loan Mortgage Corporation
Bought by
Kimbrell Vicente H and Kimbrell Angel
Home Financials for this Owner
Home Financials are based on the most recent Mortgage that was taken out on this home.
Original Mortgage
$101,850
Interest Rate
6.04%
Mortgage Type
FHA
Purchase Details
Closed on
Jul 11, 2008
Sold by
Schneider Jeffery A and Schneider Cristy M
Bought by
Federal Home Loan Mortgage Corp
Purchase Details
Closed on
Aug 14, 1992
Sold by
Szozda Aline M
Create a Home Valuation Report for This Property
The Home Valuation Report is an in-depth analysis detailing your home's value as well as a comparison with similar homes in the area
Home Values in the Area
Average Home Value in this Area
Purchase History
| Date | Buyer | Sale Price | Title Company |
|---|---|---|---|
| Deluna Elena | $110,000 | Liberty Title Inc | |
| Kimbrell Vicente H | -- | Attorney | |
| Federal Home Loan Mortgage Corp | $96,000 | None Available | |
| -- | $64,000 | -- |
Source: Public Records
Mortgage History
| Date | Status | Borrower | Loan Amount |
|---|---|---|---|
| Open | Deluna Elena | $96,662 | |
| Previous Owner | Kimbrell Vicente H | $101,850 |
Source: Public Records
Tax History Compared to Growth
Tax History
| Year | Tax Paid | Tax Assessment Tax Assessment Total Assessment is a certain percentage of the fair market value that is determined by local assessors to be the total taxable value of land and additions on the property. | Land | Improvement |
|---|---|---|---|---|
| 2024 | $1,468 | $61,390 | $11,725 | $49,665 |
| 2023 | $2,558 | $45,500 | $9,555 | $35,945 |
| 2022 | $2,576 | $45,500 | $9,555 | $35,945 |
| 2021 | $2,596 | $45,500 | $9,555 | $35,945 |
| 2020 | $2,575 | $40,110 | $8,155 | $31,955 |
| 2019 | $2,503 | $40,110 | $8,155 | $31,955 |
| 2018 | $2,451 | $40,110 | $8,155 | $31,955 |
| 2017 | $2,455 | $36,890 | $8,050 | $28,840 |
| 2016 | $2,424 | $105,400 | $23,000 | $82,400 |
| 2015 | $2,409 | $105,400 | $23,000 | $82,400 |
| 2014 | $2,204 | $36,160 | $7,880 | $28,280 |
| 2013 | $2,204 | $36,160 | $7,880 | $28,280 |
Source: Public Records
Map
Nearby Homes
- 3216 Brown Rd
- 1339 Eastmeadow Dr
- 1927 Bordeaux Rue
- 1937 S Coy Rd
- 1946 Terri Rue
- 0 Lemoyne Rd
- 127 Lemoyne Rd
- 29 Lemoyne Rd
- 123 Lemoyne Rd
- 1826 Bieber Dr
- Sweet Pea Plan at Oregon Town Center - Aspire at Oregon Town Center
- 3023 Nautical Ln
- 0 Curtice Rd
- 3904 Oakfield Dr
- 2432 Brown Rd
- 3531 Goodrich Ave
- 200 Rood St
- 1126 Heritage Ln
- 1102 Heritage Ln
- 3736 Navarre Ave
- 1542 Forrester Dr
- 1530 Forrester Dr
- 3217 Brown Rd
- 1520 Eastland Dr
- 1548 Forrester Dr
- 3219 Brown Rd
- 3215 Brown Rd
- 1516 Eastland Dr
- 1535 Forrester Dr
- 1513 Eastland Dr
- 1541 Forrester Dr
- 1529 Forrester Dr
- 1547 Forrester Dr
- 1523 Forester Dr
- 1509 Eastland Dr
- 3213 Brown Rd
- 1523 Forrester Dr
- 1512 Eastland Dr
- 1517 Forester Dr
- 1512 Forrester Dr