Estimated Value: $688,000
4
Beds
3
Baths
3,741
Sq Ft
$184/Sq Ft
Est. Value
About This Home
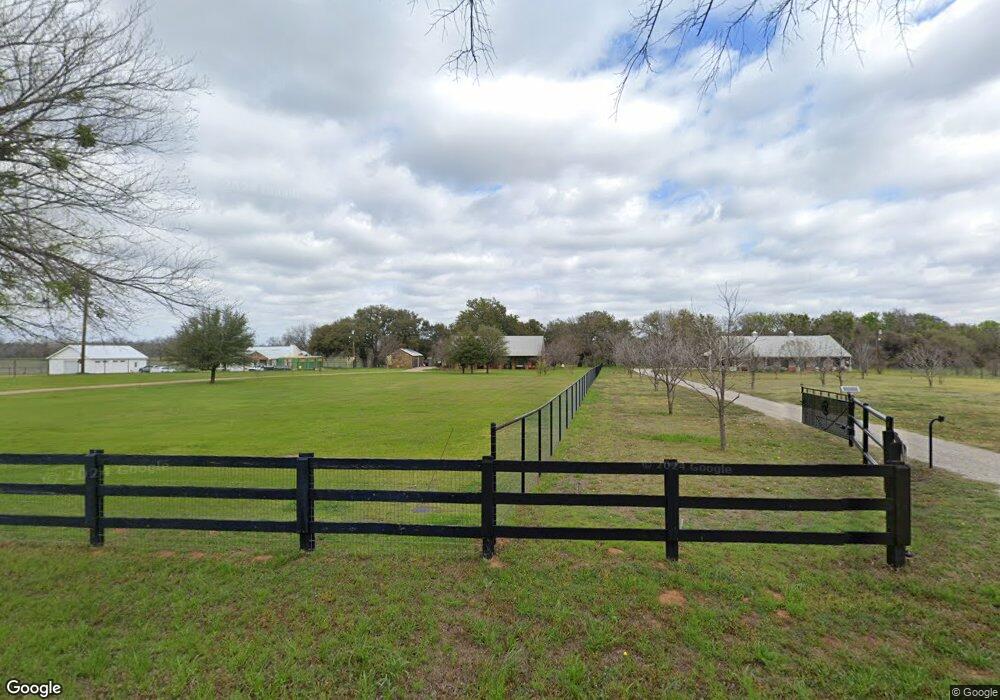
This home is located at 1537 Big Valley Cir, Lipan, TX 76462 and is currently estimated at $688,000, approximately $183 per square foot. 1537 Big Valley Cir is a home located in Parker County with nearby schools including Brock Intermediate School, Brock Junior High School, and Brock High School.
Ownership History
Date
Name
Owned For
Owner Type
Purchase Details
Closed on
May 25, 2018
Sold by
Sinquefield Ronnie Wade and Sinquefield Karen Marie
Bought by
Russom Troy Duncan and Russom Sandy Denise
Current Estimated Value
Home Financials for this Owner
Home Financials are based on the most recent Mortgage that was taken out on this home.
Original Mortgage
$430,400
Outstanding Balance
$370,589
Interest Rate
4.4%
Mortgage Type
New Conventional
Estimated Equity
$317,411
Purchase Details
Closed on
Aug 31, 2015
Sold by
Sinquefield Ronnie Wade and Sinquefield Karen Marie
Bought by
Sinquefield Ronnie Wade and Si Karen Marie
Purchase Details
Closed on
Apr 16, 2008
Sold by
Colgin Russell and Colgin Jill
Bought by
Sinquefield Joe and Sinquefield Jo Nell
Purchase Details
Closed on
Nov 30, 2004
Sold by
Beard Beard S and Beard Buckner F
Bought by
Sinquefield Family Trust
Create a Home Valuation Report for This Property
The Home Valuation Report is an in-depth analysis detailing your home's value as well as a comparison with similar homes in the area
Home Values in the Area
Average Home Value in this Area
Purchase History
| Date | Buyer | Sale Price | Title Company |
|---|---|---|---|
| Russom Troy Duncan | -- | None Available | |
| Sinquefield Ronnie Wade | -- | None Available | |
| Sinquefield Joe | -- | Fnt | |
| Sinquefield Family Trust | -- | -- |
Source: Public Records
Mortgage History
| Date | Status | Borrower | Loan Amount |
|---|---|---|---|
| Open | Russom Troy Duncan | $430,400 |
Source: Public Records
Tax History Compared to Growth
Tax History
| Year | Tax Paid | Tax Assessment Tax Assessment Total Assessment is a certain percentage of the fair market value that is determined by local assessors to be the total taxable value of land and additions on the property. | Land | Improvement |
|---|---|---|---|---|
| 2025 | $7,623 | $528,000 | -- | -- |
| 2024 | $7,623 | $480,000 | $53,180 | $426,820 |
| 2023 | $7,623 | $495,630 | $53,180 | $442,450 |
| 2022 | $9,538 | $469,800 | $30,000 | $439,800 |
| 2021 | $9,608 | $469,800 | $30,000 | $439,800 |
| 2020 | $8,856 | $409,140 | $30,000 | $379,140 |
| 2019 | $9,536 | $409,140 | $30,000 | $379,140 |
| 2018 | $8,960 | $386,970 | $11,750 | $375,220 |
| 2017 | $8,005 | $386,970 | $11,750 | $375,220 |
| 2016 | $7,277 | $316,310 | $11,620 | $304,690 |
| 2015 | $6,437 | $316,310 | $11,620 | $304,690 |
| 2014 | $6,228 | $281,650 | $9,240 | $272,410 |
Source: Public Records
Map
Nearby Homes
- TBD A Big Valley Cir
- 635 Big Valley Cir
- 7110 Farm To Market Road 1189
- 141 Lakeside Dr
- Lot 17 Lakeside Dr
- 227 Sugartree Cir
- 1208 Eagles Bluff Dr
- 4029 Fall Creek Dr
- TBD Lakeside Dr
- 1255 Eagles Bluff Dr
- 117 Birdie Dr
- 1024 Brock Heights Ct
- 431 Sugartree Dr
- 5391 Fm 1189
- 3012 Fall Creek Dr
- 119 Sugartree Cir
- 441 Sugartree Dr
- 223 Sugar Tree Dr
- 2028 Little Valley Ct
- 661 S Sugartree Dr
- 1501 Big Valley Cir
- 1414 Big Valley Cir
- 1750 Big Valley Cir
- 1750 Big Valley Cir
- 1750 Big Valley Cir
- 1750 Big Valley Cir
- 1750 Big Valley Cir
- 1750 Big Valley Cir
- 1750 Big Valley Cir
- 1755 Big Valley Cir
- 1299 Big Valley Cir
- 1304 Big Valley Cir
- 1155 Big Valley Cir
- 299 Hubbard Ln
- 1095 Big Valley Cir
- 300 Hubbard Ln
- 401 Hubbard Ln
- 1041 Big Valley Cir
- 1040 Big Valley Cir
- 700 Hiner Rd