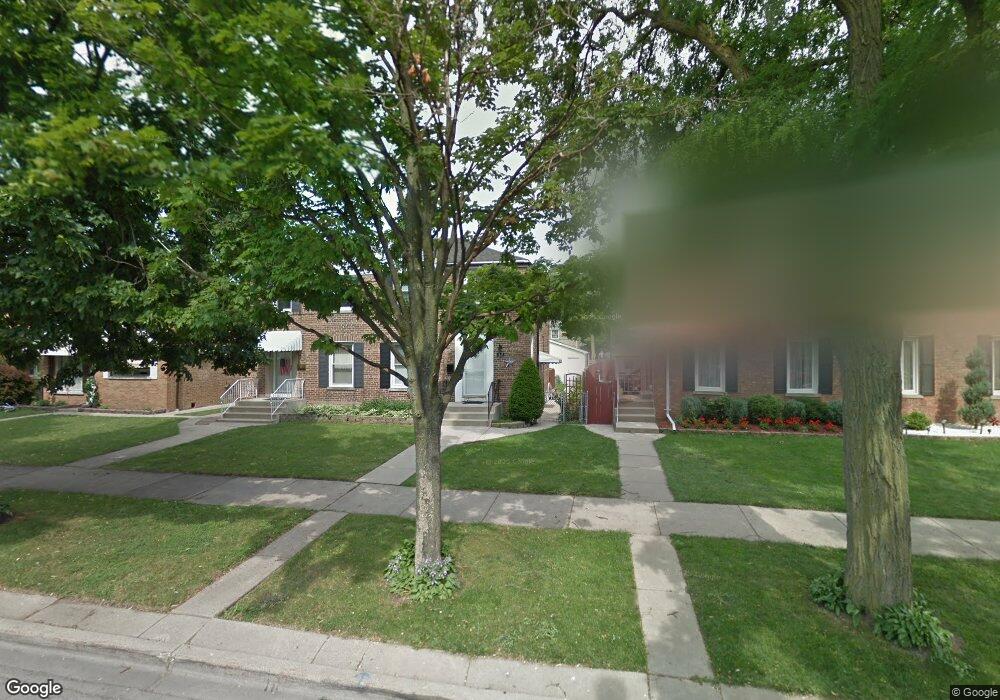
1537 N 20th Ave Melrose Park, IL 60160
Estimated Value: $262,000 - $294,469
3
Beds
1
Bath
1,000
Sq Ft
$283/Sq Ft
Est. Value
About This Home
This home is located at 1537 N 20th Ave, Melrose Park, IL 60160 and is currently estimated at $283,117, approximately $283 per square foot. 1537 N 20th Ave is a home located in Cook County with nearby schools including Melrose Park Elementary School, Stevenson Middle School, and Proviso East High School.
Ownership History
Date
Name
Owned For
Owner Type
Purchase Details
Closed on
Jan 18, 2005
Sold by
Sesso Georgianne
Bought by
Mckenzie Joseph A and Ricci Marjorie J
Current Estimated Value
Home Financials for this Owner
Home Financials are based on the most recent Mortgage that was taken out on this home.
Original Mortgage
$172,800
Outstanding Balance
$87,705
Interest Rate
5.83%
Mortgage Type
Unknown
Estimated Equity
$195,412
Purchase Details
Closed on
Jul 26, 2004
Sold by
Torres Luis C
Bought by
Sesso Georgianne
Purchase Details
Closed on
Oct 15, 2003
Sold by
Torres Karen B
Bought by
Torres Luis C
Purchase Details
Closed on
Mar 12, 1997
Sold by
Fabiani Ronald R
Bought by
Torres Luis C and Torres Karen B
Home Financials for this Owner
Home Financials are based on the most recent Mortgage that was taken out on this home.
Original Mortgage
$94,581
Interest Rate
7.95%
Mortgage Type
FHA
Create a Home Valuation Report for This Property
The Home Valuation Report is an in-depth analysis detailing your home's value as well as a comparison with similar homes in the area
Home Values in the Area
Average Home Value in this Area
Purchase History
| Date | Buyer | Sale Price | Title Company |
|---|---|---|---|
| Mckenzie Joseph A | $192,000 | Chicago Title Insurance Comp | |
| Sesso Georgianne | $140,000 | Chicago Title Insurance Comp | |
| Torres Luis C | -- | -- | |
| Torres Luis C | $95,000 | Attorneys Natl Title Network |
Source: Public Records
Mortgage History
| Date | Status | Borrower | Loan Amount |
|---|---|---|---|
| Open | Mckenzie Joseph A | $172,800 | |
| Previous Owner | Torres Luis C | $94,581 |
Source: Public Records
Tax History Compared to Growth
Tax History
| Year | Tax Paid | Tax Assessment Tax Assessment Total Assessment is a certain percentage of the fair market value that is determined by local assessors to be the total taxable value of land and additions on the property. | Land | Improvement |
|---|---|---|---|---|
| 2024 | $5,115 | $23,000 | $3,179 | $19,821 |
| 2023 | $4,341 | $23,000 | $3,179 | $19,821 |
| 2022 | $4,341 | $17,509 | $2,750 | $14,759 |
| 2021 | $4,436 | $17,507 | $2,749 | $14,758 |
| 2020 | $4,381 | $17,507 | $2,749 | $14,758 |
| 2019 | $4,105 | $16,091 | $2,491 | $13,600 |
| 2018 | $4,088 | $16,091 | $2,491 | $13,600 |
| 2017 | $4,015 | $16,091 | $2,491 | $13,600 |
| 2016 | $2,934 | $11,652 | $2,234 | $9,418 |
| 2015 | $2,849 | $11,652 | $2,234 | $9,418 |
| 2014 | $2,777 | $11,652 | $2,234 | $9,418 |
| 2013 | $2,886 | $12,910 | $2,234 | $10,676 |
Source: Public Records
Map
Nearby Homes
- 1540 N 21st Ave
- 1514 N 22nd Ave
- 1634 N 22nd Ave
- 1724 N 19th Ave
- 1531 N 24th Ave
- 1630 N 15th Ave
- 1710 N 23rd Ave
- 1418 N 24th Ave
- 1718 N 15th Ave
- 1815 N 22nd Ave
- 1209 Helen Dr
- 1822 N 23rd Ave
- 1832 N 23rd Ave
- 1202 Elsie Dr
- 1616 N 12th Ave
- 805 N 22nd Ave
- 923 Division St
- 1933 N 18th Ave
- 1940 N 19th Ave
- 1200 N 11th Ave
- 1539 N 20th Ave
- 1535 N 20th Ave
- 1533 N 20th Ave
- 1533 N 20th Ave Unit 1533
- 1533 N 20th Ave Unit 1
- 1541 N 20th Ave
- 1531 N 20th Ave
- 1543 N 20th Ave
- 1529 N 20th Ave
- 1525 N 20th Ave
- 1538 Broadway St
- 1536 N 19th Ave
- 1536 N 19th Ave
- 1536 Broadway St
- 1538 N 19th Ave
- 1538 Broadway St
- 1523 N 20th Ave
- 1532 N 19th Ave
- 1530 N 19th Ave
- 1534 N 19th Ave