15372 Lons Redford, MI 48239
Estimated Value: $105,299 - $135,000
2
Beds
1
Bath
768
Sq Ft
$153/Sq Ft
Est. Value
About This Home
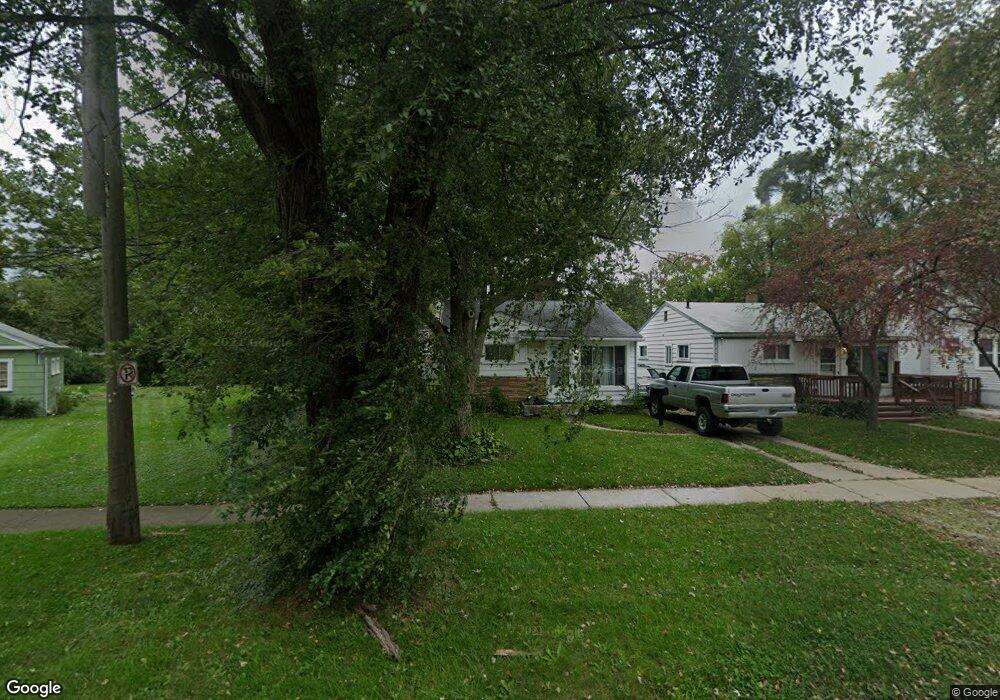
This home is located at 15372 Lons, Redford, MI 48239 and is currently estimated at $117,325, approximately $152 per square foot. 15372 Lons is a home located in Wayne County with nearby schools including Beech Elementary School, Hilbert Elementary School, and Detroit Leadership Academy.
Ownership History
Date
Name
Owned For
Owner Type
Purchase Details
Closed on
Jun 18, 2019
Sold by
Libby Sharon Kay and Mcgough Tammy A
Bought by
Gardella William Joseph and Gardella William Jeffery
Current Estimated Value
Purchase Details
Closed on
Mar 9, 2019
Sold by
Mcgough Tammy A and Mcgough Cody A
Bought by
Libby Sharon K and Mcgough Tammy A
Purchase Details
Closed on
Oct 17, 2017
Sold by
Libby Sharon Kay
Bought by
Mcgough Tammy A
Purchase Details
Closed on
Jun 1, 2017
Sold by
Libby Sharon Kay
Bought by
Libby Sharon Kay
Purchase Details
Closed on
Feb 17, 2012
Sold by
Mi Seven Llc
Bought by
Libby Sharon Kay
Purchase Details
Closed on
May 2, 2011
Sold by
Bac Home Loans Servicing Lp
Bought by
Federal National Mortgage Association
Purchase Details
Closed on
Feb 24, 2011
Sold by
Westbrook James A
Bought by
Bac Home Loans Servicing Lp
Purchase Details
Closed on
Jun 13, 2001
Sold by
Jacobsen Amy C
Bought by
Westbrook James A
Create a Home Valuation Report for This Property
The Home Valuation Report is an in-depth analysis detailing your home's value as well as a comparison with similar homes in the area
Home Values in the Area
Average Home Value in this Area
Purchase History
| Date | Buyer | Sale Price | Title Company |
|---|---|---|---|
| Gardella William Joseph | $42,000 | Liberty Title | |
| Libby Sharon K | -- | None Available | |
| Mcgough Tammy A | -- | None Available | |
| Libby Sharon Kay | -- | None Available | |
| Libby Sharon Kay | $11,000 | First Centennial Title Inc | |
| Federal National Mortgage Association | -- | None Available | |
| Bac Home Loans Servicing Lp | $7,300 | None Available | |
| Westbrook James A | $68,500 | -- |
Source: Public Records
Tax History Compared to Growth
Tax History
| Year | Tax Paid | Tax Assessment Tax Assessment Total Assessment is a certain percentage of the fair market value that is determined by local assessors to be the total taxable value of land and additions on the property. | Land | Improvement |
|---|---|---|---|---|
| 2025 | $679 | $43,700 | $0 | $0 |
| 2024 | $679 | $39,000 | $0 | $0 |
| 2023 | $647 | $33,400 | $0 | $0 |
| 2022 | $1,647 | $27,200 | $0 | $0 |
| 2021 | $1,601 | $26,100 | $0 | $0 |
| 2020 | $1,580 | $22,600 | $0 | $0 |
| 2019 | $1,105 | $19,700 | $0 | $0 |
| 2018 | $394 | $16,800 | $0 | $0 |
| 2017 | $1,016 | $15,900 | $0 | $0 |
| 2016 | $1,151 | $16,100 | $0 | $0 |
| 2015 | $1,414 | $14,800 | $0 | $0 |
| 2013 | $1,370 | $14,300 | $0 | $0 |
| 2012 | $1,420 | $15,300 | $4,100 | $11,200 |
Source: Public Records
Map
Nearby Homes
- 25301 5 Mile Rd Unit 125
- 25301 5 Mile Rd
- 25301 5 Mile Rd Unit 109
- 25301 5 Mile Rd Unit 230
- 25339 Keeler
- Vacant Lola Dr
- 15478 Lola Dr
- 15065 Garfield
- 15369 Leona Dr
- 15067 Sumner
- 15332 Leona Dr
- Vacant Leona Dr
- 15741 Pomona Dr
- 15034 Sumner
- 15028 Sumner
- 15512 Dixie
- 15048 Beech Daly Rd
- 15051 Dixie
- 15843 Knight
- 15861 Knight