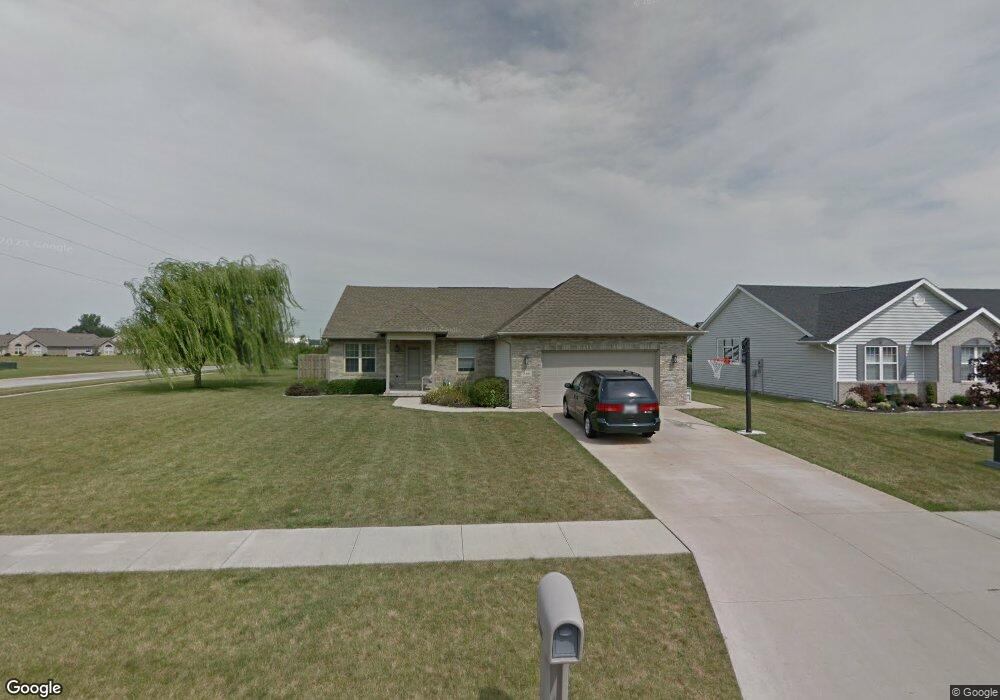
15378 Bent Tree Dr Findlay, OH 45840
Estimated Value: $360,000 - $380,000
4
Beds
2
Baths
2,080
Sq Ft
$177/Sq Ft
Est. Value
About This Home
This home is located at 15378 Bent Tree Dr, Findlay, OH 45840 and is currently estimated at $368,422, approximately $177 per square foot. 15378 Bent Tree Dr is a home located in Hancock County with nearby schools including Van Buren Elementary School, Van Buren Middle School, and Van Buren High School.
Ownership History
Date
Name
Owned For
Owner Type
Purchase Details
Closed on
Mar 6, 2008
Sold by
Ho Andy and Ho Elizabeth N
Bought by
Fisher Bradley A and Fisher Felicia
Current Estimated Value
Home Financials for this Owner
Home Financials are based on the most recent Mortgage that was taken out on this home.
Original Mortgage
$136,000
Outstanding Balance
$84,771
Interest Rate
5.75%
Mortgage Type
Purchase Money Mortgage
Estimated Equity
$283,651
Purchase Details
Closed on
Aug 16, 1999
Sold by
Best Roger
Bought by
Ho Andy and Ho Elizabeth
Home Financials for this Owner
Home Financials are based on the most recent Mortgage that was taken out on this home.
Original Mortgage
$123,200
Interest Rate
7.5%
Mortgage Type
New Conventional
Create a Home Valuation Report for This Property
The Home Valuation Report is an in-depth analysis detailing your home's value as well as a comparison with similar homes in the area
Home Values in the Area
Average Home Value in this Area
Purchase History
| Date | Buyer | Sale Price | Title Company |
|---|---|---|---|
| Fisher Bradley A | $170,000 | Assured Title | |
| Ho Andy | $154,000 | -- |
Source: Public Records
Mortgage History
| Date | Status | Borrower | Loan Amount |
|---|---|---|---|
| Open | Fisher Bradley A | $136,000 | |
| Previous Owner | Ho Andy | $123,200 |
Source: Public Records
Tax History Compared to Growth
Tax History
| Year | Tax Paid | Tax Assessment Tax Assessment Total Assessment is a certain percentage of the fair market value that is determined by local assessors to be the total taxable value of land and additions on the property. | Land | Improvement |
|---|---|---|---|---|
| 2024 | $2,834 | $90,330 | $14,250 | $76,080 |
| 2023 | $2,820 | $90,330 | $14,250 | $76,080 |
| 2022 | $2,821 | $90,330 | $14,250 | $76,080 |
| 2021 | $2,609 | $78,620 | $13,690 | $64,930 |
| 2020 | $2,607 | $78,620 | $13,690 | $64,930 |
| 2019 | $2,698 | $78,620 | $13,690 | $64,930 |
| 2018 | $2,227 | $63,880 | $11,410 | $52,470 |
| 2017 | $2,234 | $63,880 | $11,410 | $52,470 |
| 2016 | $2,174 | $63,880 | $11,410 | $52,470 |
| 2015 | $1,907 | $55,020 | $11,410 | $43,610 |
| 2014 | $1,860 | $55,020 | $11,410 | $43,610 |
| 2012 | $2,174 | $59,200 | $11,410 | $47,790 |
Source: Public Records
Map
Nearby Homes
- 7712 E Watermark Dr
- 15329 E Us Route 224
- 0 E Us Route 224
- 7507 Township Road 212
- 665 Meadowview Dr
- 0 Meadowview Dr
- 8419 E Woodland Trail
- 8457 Lakewood Dr
- 8405 Indian Lake Dr
- 0 Hickory Ln Unit 6133896
- 0 Hickory Ln Unit 1 307878
- 0 Hickory Ln Unit 20252999
- 16169 Forest Ln
- 845 Fox Run Rd
- 15680 Thornwood Dr
- 15711 Mahogany Trail
- 8478 Indian Lake Dr
- 456 Strathaven Dr
- 801 Fox Run Rd
- 6908 Township Road 212
- 15392 Bent Tree Dr
- 15375 South Point Dr
- 15375 South Point Dr
- 15375 S Point Dr
- 15379 South Point Dr
- 15379 S Point Dr
- 15379 S Point Dr Unit U10-15
- 15408 Bent Tree Dr
- 15385 South Point Dr Unit U9A
- 15385 S Point Dr
- 15373 South Point Dr
- 15377 South Point Dr
- 15375 Bent Tree Dr
- 15389 Bent Tree Dr
- 15330 Bent Tree Dr
- 15383 South Point Dr
- 15389 South Point Dr
- 15389 S Point Dr
- 15361 Bent Tree Dr
- 15405 Bent Tree Dr