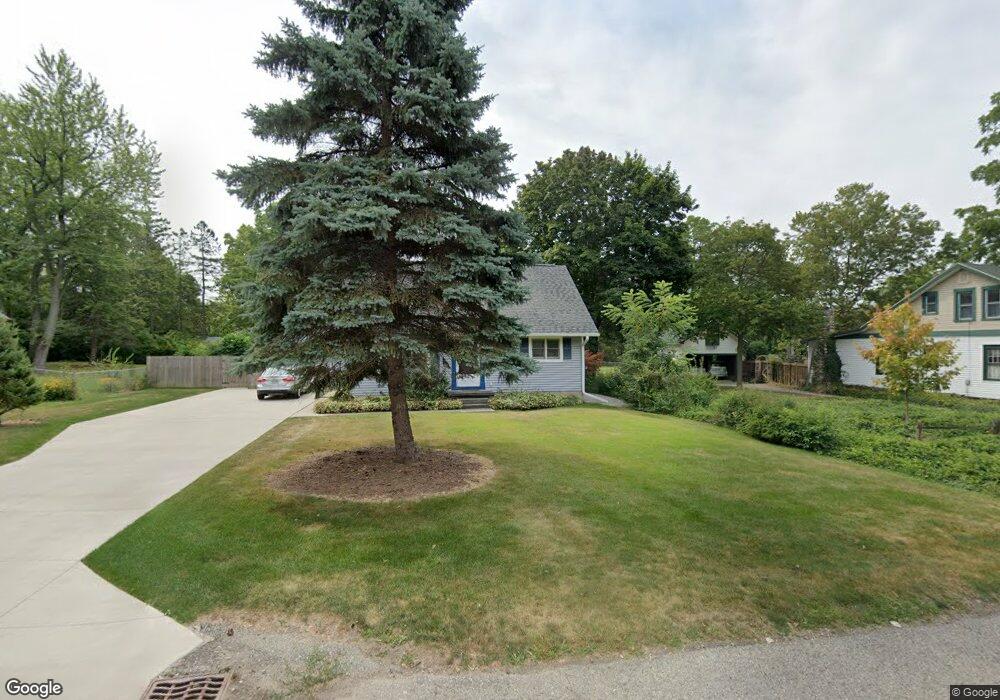
1538 Mount Vernon Ave East Lansing, MI 48823
Estimated Value: $223,000 - $275,000
3
Beds
1
Bath
1,358
Sq Ft
$179/Sq Ft
Est. Value
About This Home
This home is located at 1538 Mount Vernon Ave, East Lansing, MI 48823 and is currently estimated at $242,774, approximately $178 per square foot. 1538 Mount Vernon Ave is a home located in Ingham County with nearby schools including Marble Elementary School, MacDonald Middle School, and East Lansing High School.
Ownership History
Date
Name
Owned For
Owner Type
Purchase Details
Closed on
Jul 18, 2016
Sold by
Bonney Phillip M and Bonney Lisa M
Bought by
Dible Courtney Lyn
Current Estimated Value
Purchase Details
Closed on
Jan 19, 2006
Sold by
Bendall Mary J
Bought by
Deutsche Bank National Trust Co and Gsamp Trust 2004-Opt Mortgage Pass Throu
Purchase Details
Closed on
Oct 1, 1996
Purchase Details
Closed on
Jul 1, 1992
Purchase Details
Closed on
Sep 1, 1976
Create a Home Valuation Report for This Property
The Home Valuation Report is an in-depth analysis detailing your home's value as well as a comparison with similar homes in the area
Home Values in the Area
Average Home Value in this Area
Purchase History
| Date | Buyer | Sale Price | Title Company |
|---|---|---|---|
| Dible Courtney Lyn | $137,500 | None Available | |
| Deutsche Bank National Trust Co | $123,250 | None Available | |
| -- | $81,000 | -- | |
| -- | $70,000 | -- | |
| -- | $28,000 | -- |
Source: Public Records
Tax History Compared to Growth
Tax History
| Year | Tax Paid | Tax Assessment Tax Assessment Total Assessment is a certain percentage of the fair market value that is determined by local assessors to be the total taxable value of land and additions on the property. | Land | Improvement |
|---|---|---|---|---|
| 2025 | $4,144 | $105,200 | $32,800 | $72,400 |
| 2024 | -- | $97,100 | $32,800 | $64,300 |
| 2023 | $3,870 | $84,100 | $28,100 | $56,000 |
| 2022 | $3,708 | $74,300 | $24,300 | $50,000 |
| 2021 | $3,644 | $69,900 | $23,100 | $46,800 |
| 2020 | $3,604 | $66,700 | $23,100 | $43,600 |
| 2019 | $3,457 | $62,900 | $25,000 | $37,900 |
| 2018 | $3,780 | $61,100 | $18,200 | $42,900 |
| 2017 | $3,711 | $61,200 | $18,400 | $42,800 |
| 2016 | -- | $56,200 | $17,700 | $38,500 |
| 2015 | -- | $52,300 | $32,538 | $19,762 |
| 2014 | -- | $49,900 | $32,538 | $17,362 |
Source: Public Records
Map
Nearby Homes
- 586 Lexington Ave
- 1550 Ann St
- 688 Moorland Dr Unit 9
- 1719 Woodside Dr
- 933 Bedford Rd
- 1124 Burcham Dr
- 235 Maplewood Dr
- 1544 Haslett Rd
- 5435 Blue Haven Dr
- 15403 Short St
- 831 Lenna Keith Cir Unit 22
- 894 Lenna Keith Cir
- 704 Beech St
- 696 Beech St
- 1351 Foxcroft Rd
- 5604 Deville Ct
- 5190 Park Lake Rd
- 1539 N Hagadorn Rd Unit 1A
- 753 E Saginaw St
- 5680 Deville Ct Unit 61
- 1530 Mount Vernon Ave
- 1546 Mount Vernon Ave
- 1551 Mount Vernon Ave
- 1520 Mt Vernon 1522
- 1520 Mt Vernon Ave & 1522
- 1520 Mount Vernon Ave
- 1552 Mount Vernon Ave
- 1541 E Mt Vernon
- 1541 Mt Vernon Ave
- 1533 Mount Vernon Ave
- 1533 Mt Vernon Ave
- 1541 Snyder Rd
- 1527 Mount Vernon Ave
- 1551 Snyder Rd
- 1531 Snyder Rd
- 630 N Hagadorn Rd
- 1549/1551 Mt Vernon
- 1541 Mt Vernon
- 1541 Mt Vernon
- 1541 Mt Vernon